
Isn’t Norway a Strange Shape? Creating Tilemap Datasets with Tableau
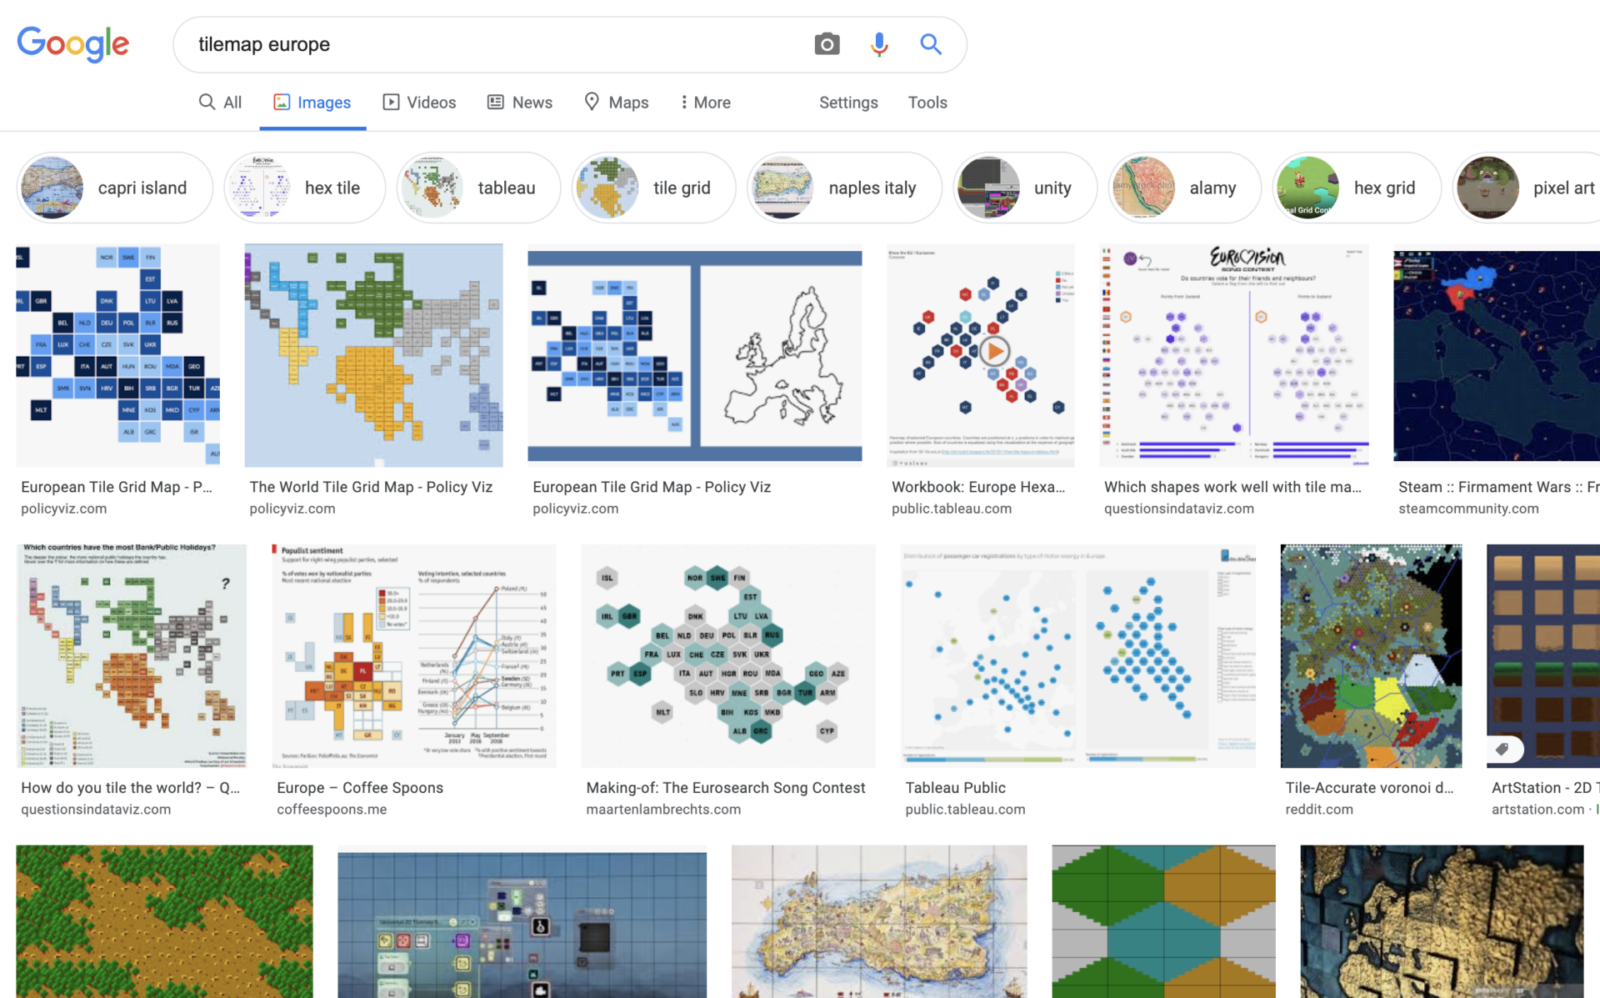
Tilemaps remain a very popular way of representing geographic data, especially when small geographic entities need to be given equal visual prominence to large ones. There are many examples available for visualizing the states in the USA, where the geography lends itself quite well to tiles. For other areas of the world, there are surprisingly few good examples. For example, a Google image search for tilemap europe yields only a handful of relevant matches:
One of these is in fact an attempt I made at a European tilemap way back in 2015 that I posted to Tableau Public – https://tinyurl.com/europehexmap – it’s a sign of just how old it now is that the UK’s membership of the EU seemed quite secure to me at that time. It remains my most viewed viz by quite some distance, so clearly the Tableau community is looking for a good European tilemap. But one thing that irritated me at the time was the fiddly process of generating the coordinates for each country. Ever since then I’ve had in the back of my mind that there must be a better way. Finally I got around to doing something about it 🙂
Others have discussed tilemaps in great detail (see the collection of links at the bottom of the article), and I’m not going to repeat those discussions here. But as a very brief tilemap 101, in an ideal world a tilemap would give each territory equal weight, and yet still preserve a somewhat recognisable geography. As more perceptive readers may have noticed however, our world is far from ideal. It’s neatly summed up by the best question anyone ever asked the Scottish comedian Billy Connolly: “Isn’t Norway a strange shape?” (for the full story, and if you don’t mind strong language, invest 15 minutes of your life listening to Billy in full flow here – https://vimeo.com/55026759).

Such geometric contortions are at the heart of the problems with European tilemaps. Compared to the US states, the countries of Europe are lumpy and misshapen. Despite the European powers fondness for imposing straight line boundaries on many non-Europeans around the globe, their own borders are sinuous and meandering, giving rise to an abundance of weird and wonderful exclaves and enclaves (a story for another time…). Worse than that, there are a bewildering array of small, sort-of-countries that us tilemappers are usually all too happy to ignore (guilty as charged, see my tilemap mentioned above). Whether it’s Grand Duchies, small Principalities, teensy Republics or miniscule Bailiwicks, the geography of Europe is cluttered and complex. For the purposes of this exercise I stuck to all the territories with an official 2-letter ISO 3166 code. It seemed as good a cut-off criterion as any, and handily meant I could avoid dealing with various British Overseas Territories and assorted breakaway statelets with varying degrees of international recognition…
The Tilemap Generator
What this convoluted geography means is that there is no definitive tilemap template for Europe that we can draw upon. For some use cases it will be important to include San Marino, for others we will definitely want to see the Isle of Man, and often, but sadly not always, we can safely ignore the Vatican City. So rather than trying to make a cumbersome collection of templates to cover every conceivable use case, I instead decided to leave the hard work to you, dear reader 🙂 What better way to handle such complexity than a handy visual tool to let you create your own tilemaps, right in Tableau?
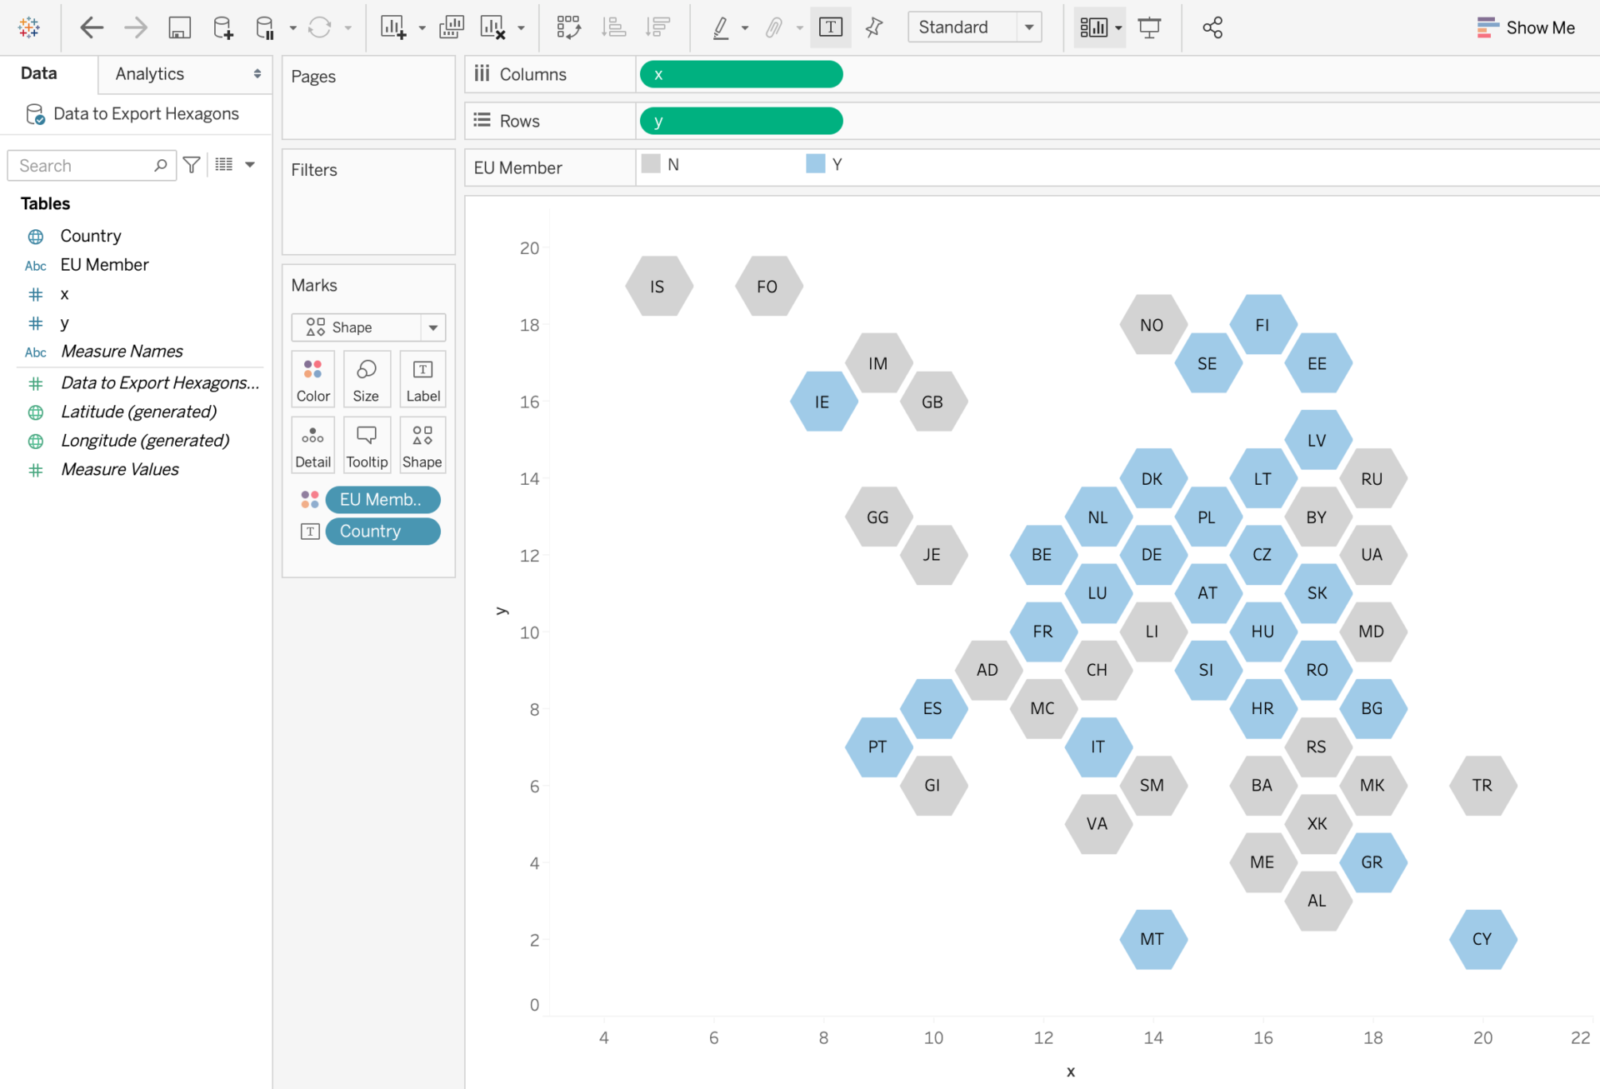
The nuts and bolts are pretty straightforward. A simple 20×20 x, y grid dataset is used as a scaffold for visualizing a blank tilemap, and a parameter is added to define the list of countries available to the user. Then, via the magic of parameter actions, it’s as simple as selecting a country and clicking on the desired tile. This adds the country and the coordinates of the selected tile to a second parameter, which serves as the dataset to be exported. For usability we add a couple of simple extras: firstly, the ability to correct any mistakes, using a menu-driven parameter action; and secondly, a simple way to clear the whole map and start again if things just aren’t working out. In other words, something like this, available on Tableau Public at https://tinyurl.com/tilemapgenerator:
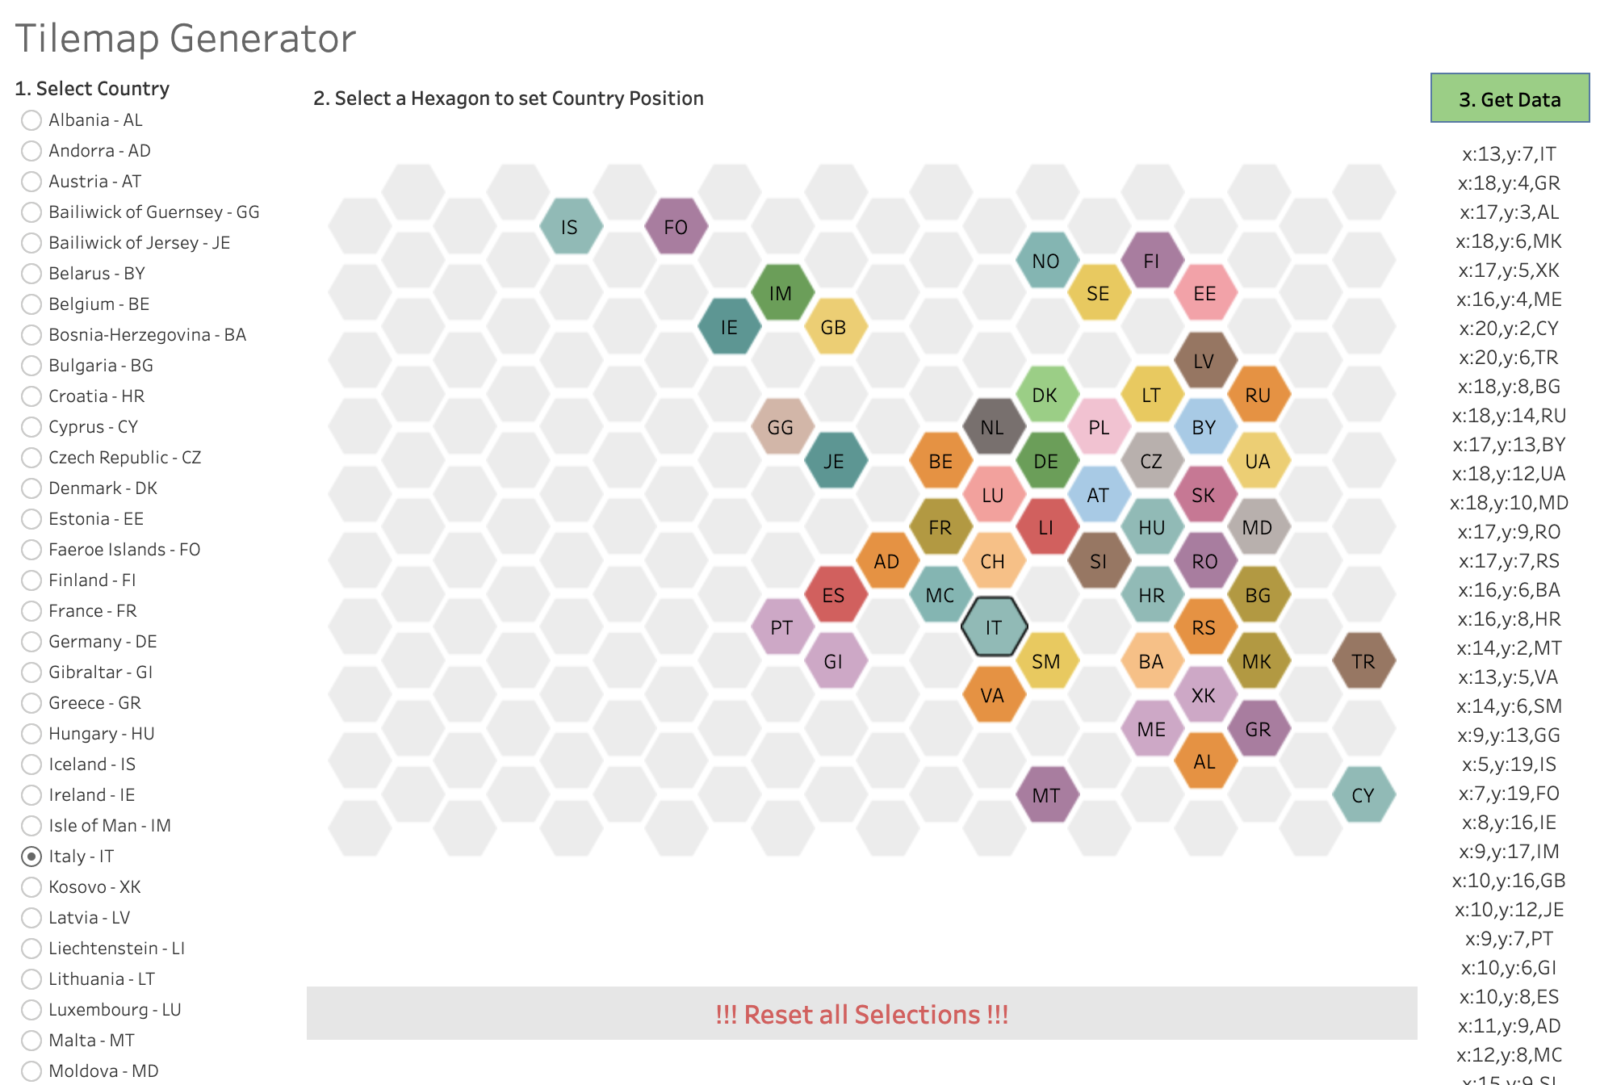
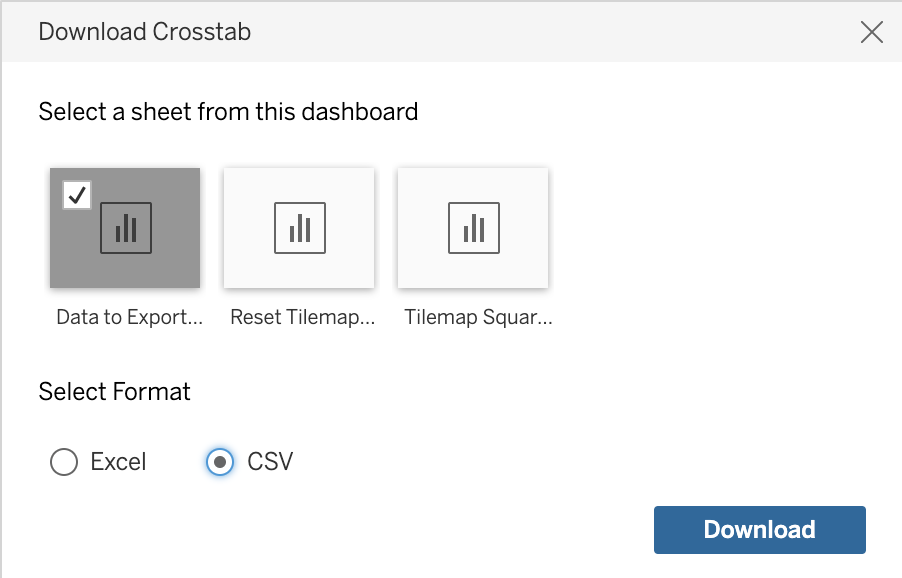
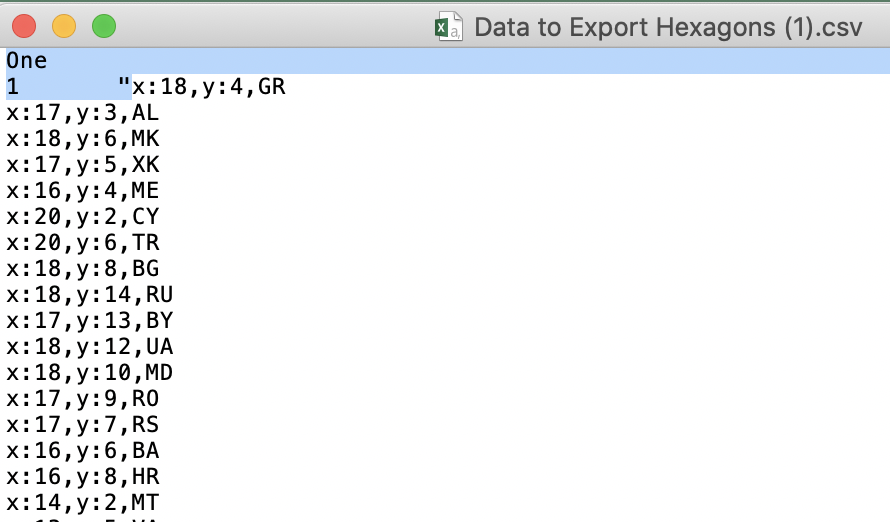
Once the countries are positioned exactly as required, clicking on the Get Data button exports the selections. An Excel export will put all the data into a single cell, with the carriage returns embedded, which is a little awkward. It’s easier to simply dump the data into a CSV file…
…then open the CSV file in a text editor. As a consequence of how the worksheet is built there is a little bit of tidying up required before we can use the file – well, this is a minimum viable product after all 🙂 Just delete the highlighted text below, as well as the closing quotation mark at the end of the file:
It’s probably also helpful to add a header row and to remove the x: and y: labels from each row using search and replace, to end up with something like this:
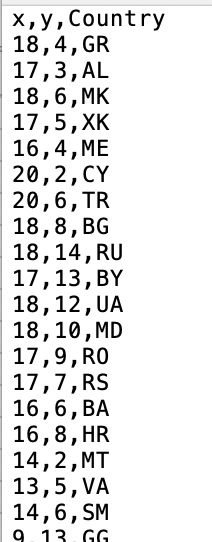
Now we have a clean dataset of the Countries and coordinates that we selected visually in the dashboard! Who says Tableau is read only?!
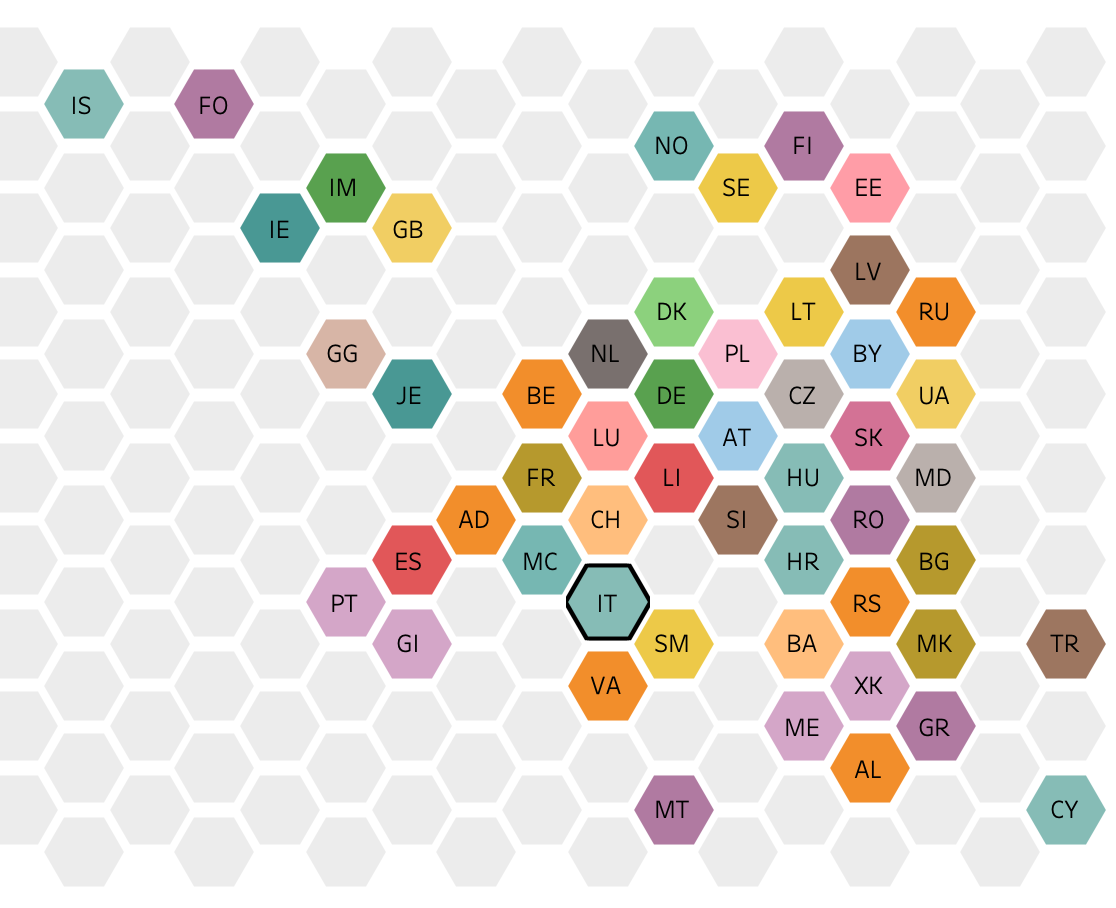
Of course we can now join this dataset to any other data we have available. For example, I could create an updated tilemap, now showing the UK (ISO code = GB, sorry Northern Ireland) outside the EU:
And of course it’s super easy to extend this tool to other geographies. Simply edit the first parameter and away you go! If the 20×20 grid isn’t quite big enough, then that can also very easily be extended. And you could also use different shapes for your tiles – a square version is included in the workbook, but I do prefer the look of the hexagons. Hopefully this will help some of you out there to create new and amazing tilemaps of your own!
Further Reading
As promised, here are some links containing further discussions/examples of tilemaps:
https://www.maartenlambrechts.com/2017/05/03/the-eurosearch-song-contest-making-of.html
https://public.tableau.com/profile/anja.pengl#!/vizhome/HexTileMapEurope/HexMapEuropa
https://public.tableau.com/profile/chrisluv#!/vizhome/LifeExpectancy_90/LifeExpectancy
https://co-data.de/2018/07/06/ironviz-recap-part-1-how-to-build-trapezium-tile-maps