
Making a Geography Game in Tableau
As a celebration of Earth Day 2020, and building on Nadine’s previous article on parameter actions, I was keen to recreate one of those “find the city” games that were popular on facebook a few years ago. Basically the idea was simple: give the user a capital city, let them click on a map to guess its location, then give a penalty score based on how far away their guess was – the lower the penalty score, the better! As usual, the simplest of ideas proved to be a little trickier to achieve. This article will only explain the broad approach, but not every step on the journey. Feel free to download the finished viz from Tableau Public and hack around with it. And of course any questions are very welcome!
First up there is the usual challenge of getting some data, in this case a list of capital cities for as many countries and territories as possible. Whilst Tableau does a pretty good job of knowing city locations, we don’t always get 100% coverage, so I generally try to create my own lat/long fields rather than rely on the auto-generated ones. Getting city names consistent with the in-built ones is also a good idea. So there was some boring grunt work to be done at the start.
With that done it is of course super easy to create a nice map in Tableau. But then the first real challenge emerges. How can we allow a user to click on the map and have the lat/long coordinates of the click registered? A quick and dirty solution to this is to simply create a big, reasonably fine-grained grid of thousands of lat/long coordinates to cover the whole globe. An easy way to do this is with some quick VBA in Excel:
Option Explicit

Sub generate_lat_long_coords()

Dim ws As Worksheet
Dim r As Range
Dim lat As Double, lon As Double

Set ws = ThisWorkbook.Worksheets("Lat Long")
Set r = ws.Range("A2")
Application.ScreenUpdating = False
Application.Calculation = xlCalculationManual

For lat = -52 To 70 Step 0.5
    For lon = -179 To 180 Step 0.5
        r.Value = lat
        r.Offset(0, 1).Value = lon
        Set r = r.Offset(1, 0)
    Next lon

Next lat


Application.ScreenUpdating = True
Application.Calculation = xlCalculationAutomatic
Set r = Nothing
Set ws = Nothing

End Sub
I won’t explain the wonders of VBA here, but be aware that the code assumes you have an Excel Worksheet called “Lat Long”. If you don’t you’ll get an error 🙂 In cells A1 and B1 on this sheet you can put the headers “Latitude” and “Longitude”. The code then loops through the specified latitude and longitude ranges and writes the values of the coordinate pairs into columns A and B, giving this:
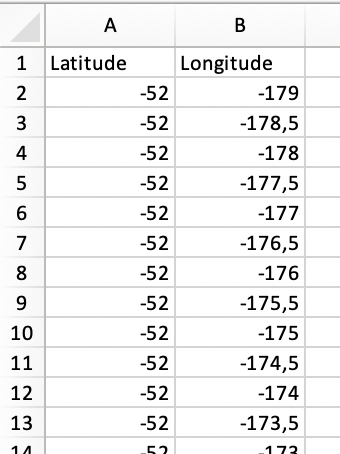
Some trial and error led me to filter the latitudes between -52°N (i.e. 52°S) and 70°N – no capital cities are in the dataset at latitudes more extreme than these – and also to go to a “grain size” of 0.5° (that’s the “Step 0.5” part of the For loops). This gives a nice balance between letting the user click (almost) anywhere on the map, 0.5° being fine-grained enough, and having too many data points to display and slowing the viz down. With this approach we have 176 155 data points for the user to choose from:
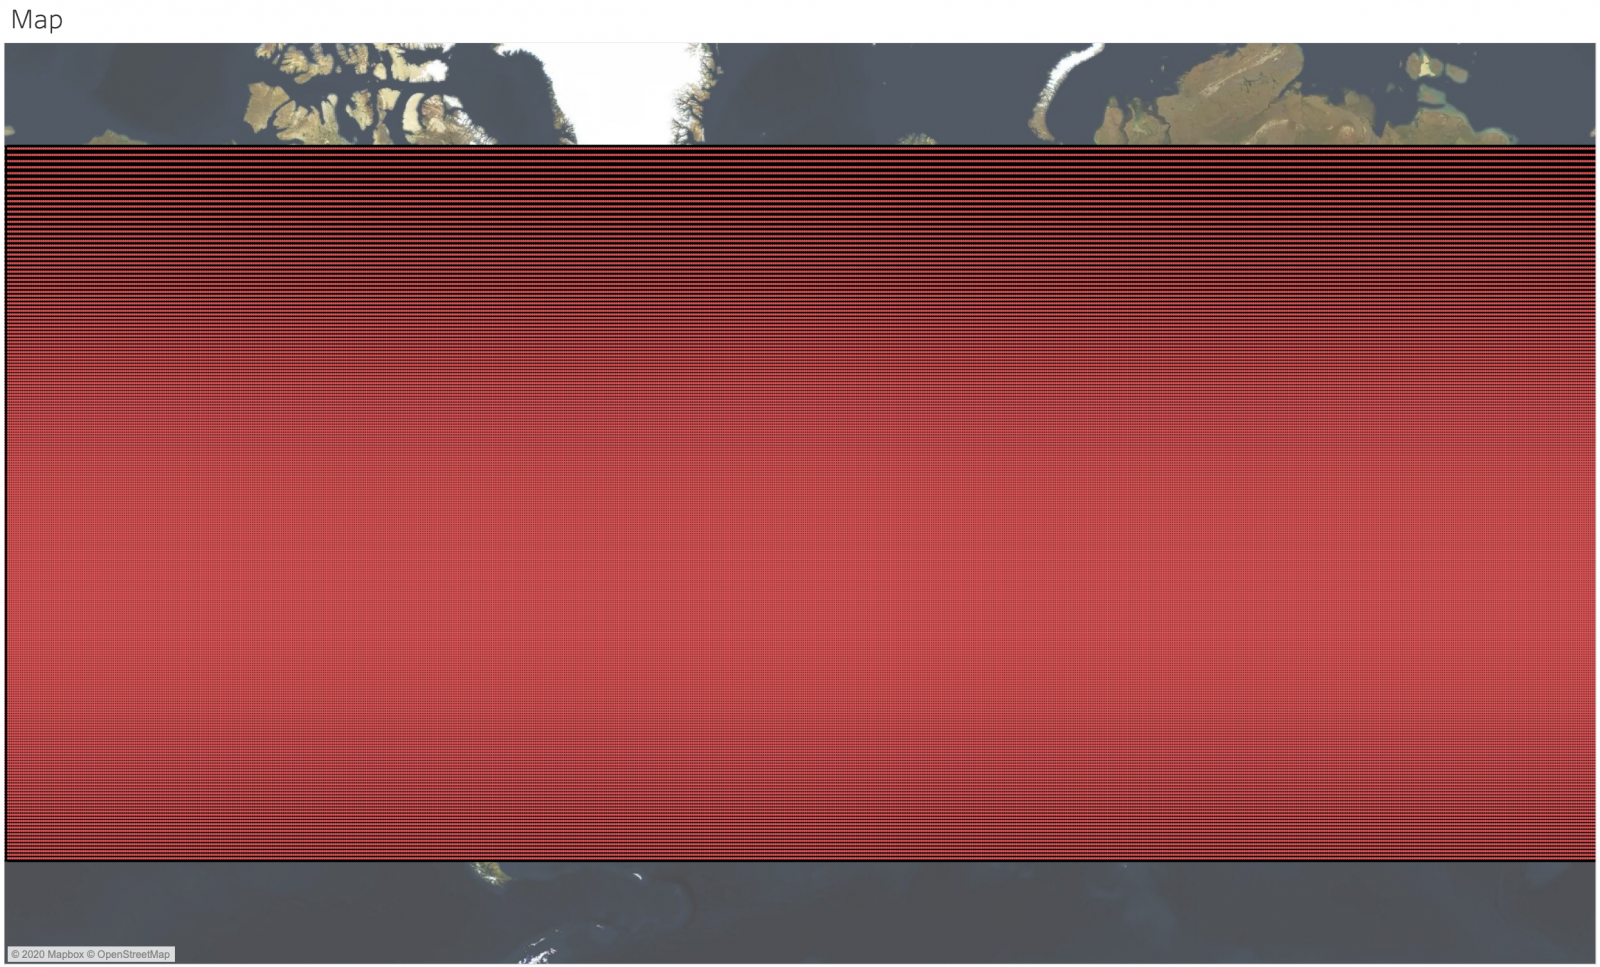
Already we start getting into some game design decisions: an early choice I made was to go for the satellite view (simply because it looks nice and will cover most of the dashboard) and importantly to disable most of the map options. This is mainly to stop users zooming in and “cheating” by using the satellite imagery to identify the city locations before they guess the location. Also, if zooming was allowed the number of lat/long coordinates needed for the grid would increase dramatically.
With the basic data in place, the next design decision was how to select the cities. After trying a few approaches I decided it would be fun to have the cities all represented by an anonymous circle, and to randomise their sort order in 2 rows, to run the full width of the screen. This felt like it was in the spirit of the game, i.e. that users should be forced to select cities more or less at random and have to make their best guesses as to the locations. In the absence of a pattern it’s not really possible for users to only choose cities that they are familiar with.

Just in case a user really wants to look for somewhere specific, I also added a couple of highlighters for city and country.
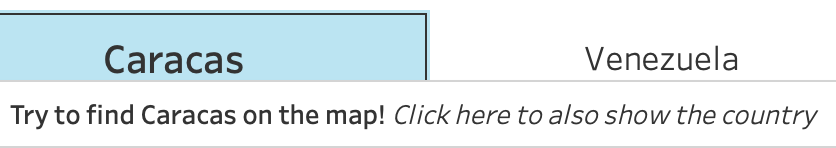
Once the user clicks on a circle, and thereby selects a city, it is important to display the city name on the screen. This is done in a simple extra sheet. Since some capitals are not so well known, some additional help is available: if the user clicks on the city name then the country will also appear. As ever, make good use of tooltips to guide your users.
So now the user knows what to search for, and they have a map with lots of points that they can click on. With this basic functionality in place we are ready to do some calculations. The awesome new DISTANCE function is what we need, but the tricky bit is getting the coordinates of the selected city and the grid point the user clicked on…
Luckily parameter actions come to the rescue. We set up four new parameters, imaginatively called P Selected Capital Lat, P Selected Capital Lon, P Sel Lat and P Sel Lon. When the user selects one of the coloured circles two parameter actions assign the lat/lon coordinates for that city to the P Selected Capital parameters. Similarly, when the user selects a grid point on the map, two parameter actions populate P Sel Lat and P Sel Lon with the selected coordinates. This gives the pair of locations we need and we can calculate the Distance between the user’s guess and the true location as follows:
DISTANCE(
 MAKEPOINT([P Selected Capital Lat],[P Select Capital Lon]),
 MAKEPOINT([P Sel Lat],[P Sel Lon]),
 'km')
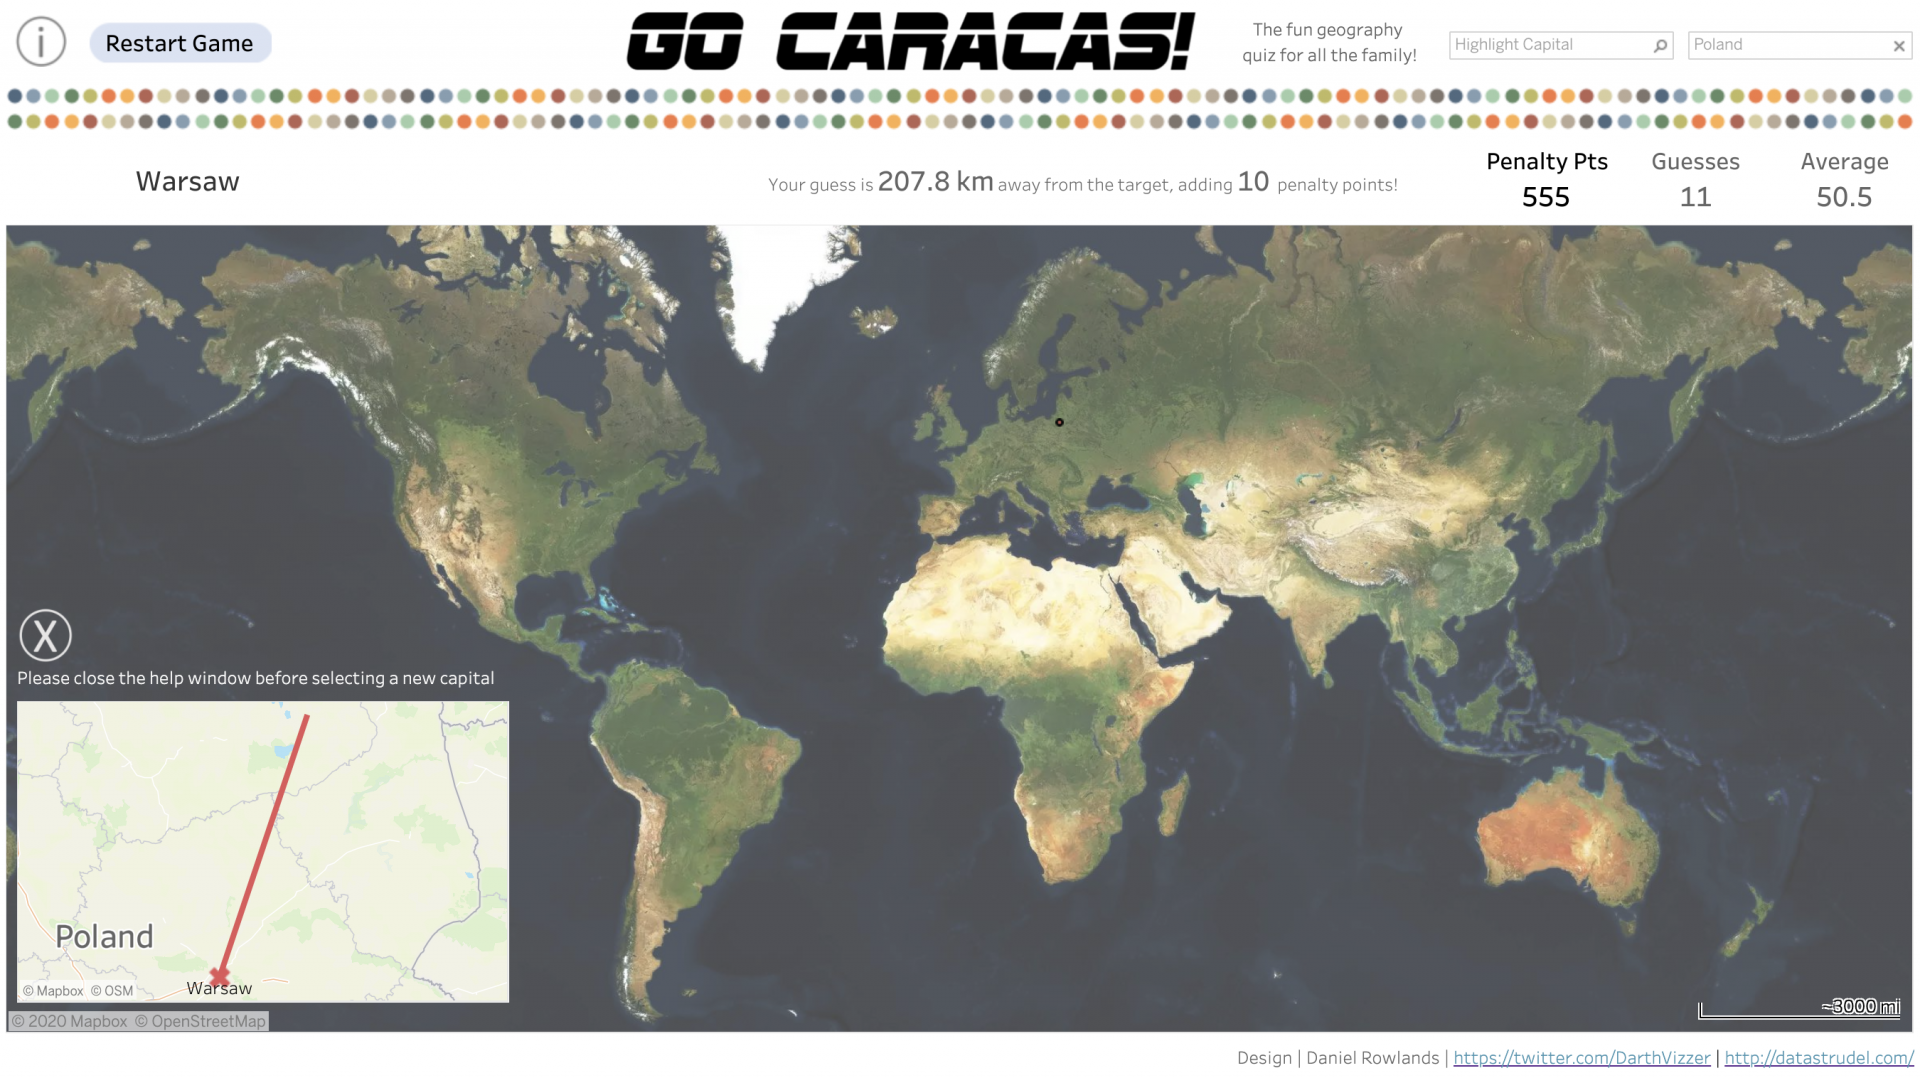
This numeric distance can then be translated into some kind of scoring system. I chose to use a penalty score, giving higher penalties for bad guesses, like the original games that inspired this project. The feedback should of course appear on-screen once the user has made their guess:

So far so good. When a guess is as bad as the one above, it would of course be nice to know where we went wrong. I added a Great Circle calculation using the doubly awesome MAKELINE function:
MAKELINE(
 MAKEPOINT([P Selected Capital Lat],[P Select Capital Lon]),
 MAKEPOINT([P Sel Lat],[P Sel Lon]))
This is then plotted on a map, but is only shown when the user expands the container it sits inside. This is done via a help icon tucked neatly away in the Pacific Ocean, west of Hawaii:
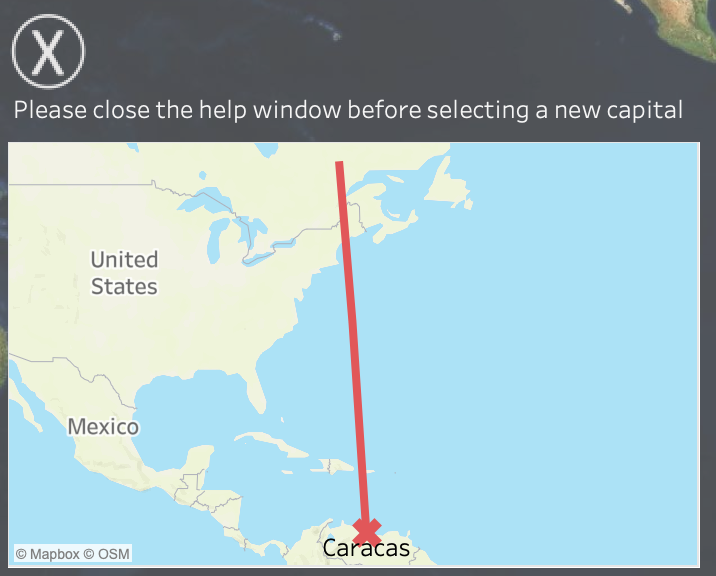
Here we run into a limitation. The container can only be collapsed manually, and this cannot be driven by a parameter value (although this would be a nice feature Tableau!). If the container is left open and a new city is selected, the location will be visible to the user and will spoil the game. All we can really do is clearly tell the user to close the window after they check their guess. But actually this bug/feature can be quite useful if you want to quickly see the locations of the capital cities for training purposes.
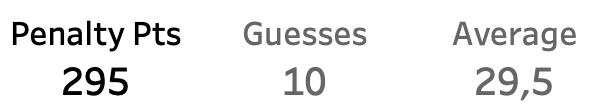
Another desirable feature is of course to keep a running score. This is straightforward enough, using a mix of parameters, parameter actions and simple calculations to increment the score and the number of guesses the user has made so far. Once this is in place we can display the user’s KPIs so far:
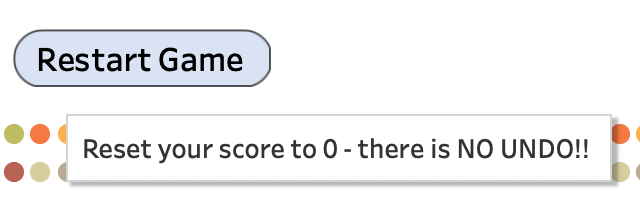
Once the user has made a few bad guesses they will most likely want to be able to reset the game. Whilst there is of course a Reset button on Tableau Public, it’s hidden away below the viz, and is perhaps not as intuitive for the user. Using, you guessed it, another parameter action and the ever-useful calculated field [Zero]=0, we can easily reset our penalty score parameter to 0 via a handy button.
One slightly tricky issue was to reset the users’ guess when a new city was selected, otherwise the previous guess would still be present and would give erroneous feedback. The reset was achieved by a parameter action setting an artificial value of P Sel Lat = 90. Since the map does not show this latitude, the user cannot have selected this value. We can then add logic to our calculations to ensure no penalty score is added for as long as P Sel Lat = 90, i.e. until the user makes a guess.
Otherwise it’s just a matter of keeping things neat and tidy to give a seamless user experience. Using parameter actions, calculated fields and filters we can ensure that the various elements of the UI get hidden/shown when appropriate.
Finally we add a retro board game-style title (as an image, since getting non-standard fonts to work on Tableau Public is still a problem) and an Info button with tooltip guidance and the job is complete!
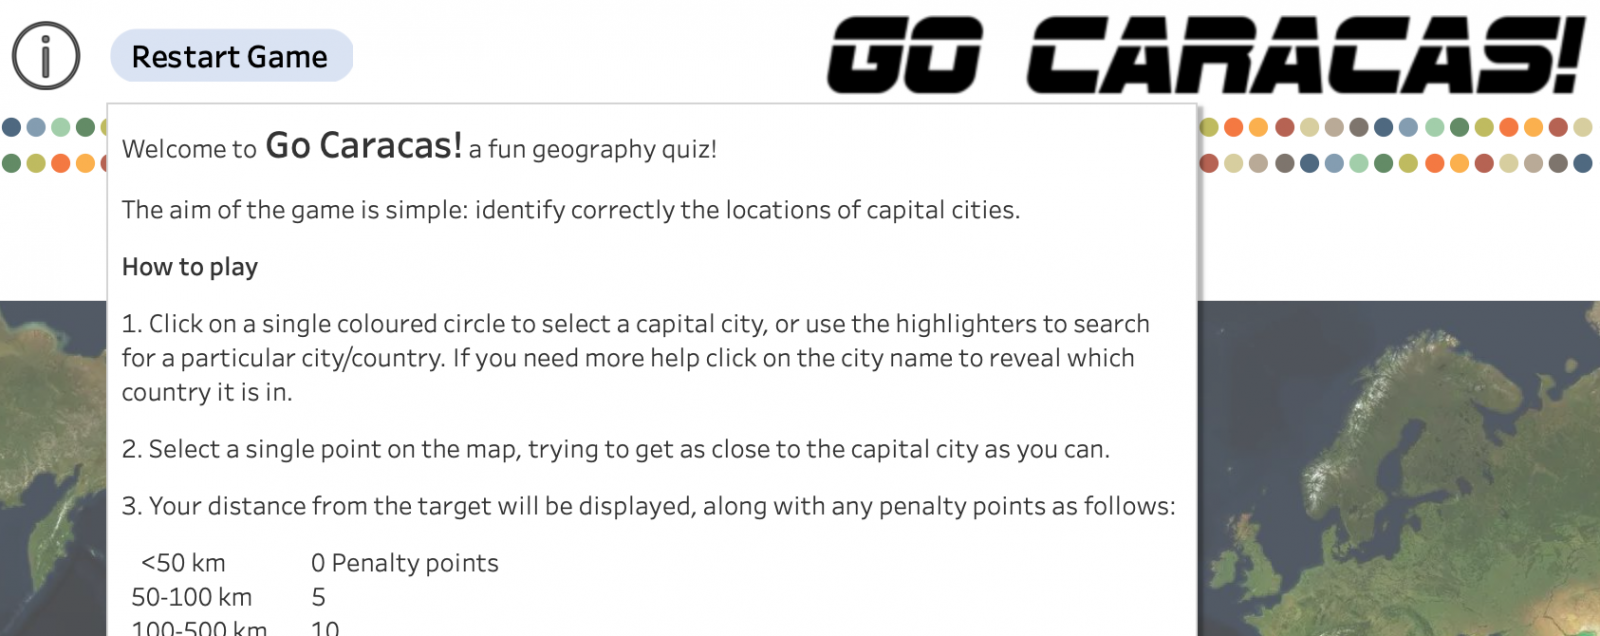
Have fun playing the finished game on Tableau Public and let us know if you have questions, suggestions or amazingly low scores to share!