
INDEX() function in Tableau
- INDEX() table calculation
- Use INDEX() to position data on the x-axis
- Top N/ Bottom N by using INDEX()
- Create a jitterplot by using the INDEX() function
Recently I participated in a „Workout Wednesday“ challenge. For everyone who doesn`t know Workout Wednesday: It is a weekly challenge and great initiative to test and expand your Tableau skills. You have to rebuild a chart in Tableau and twitter your results afterwards. Check out the Workout Wednesday website to find out more.
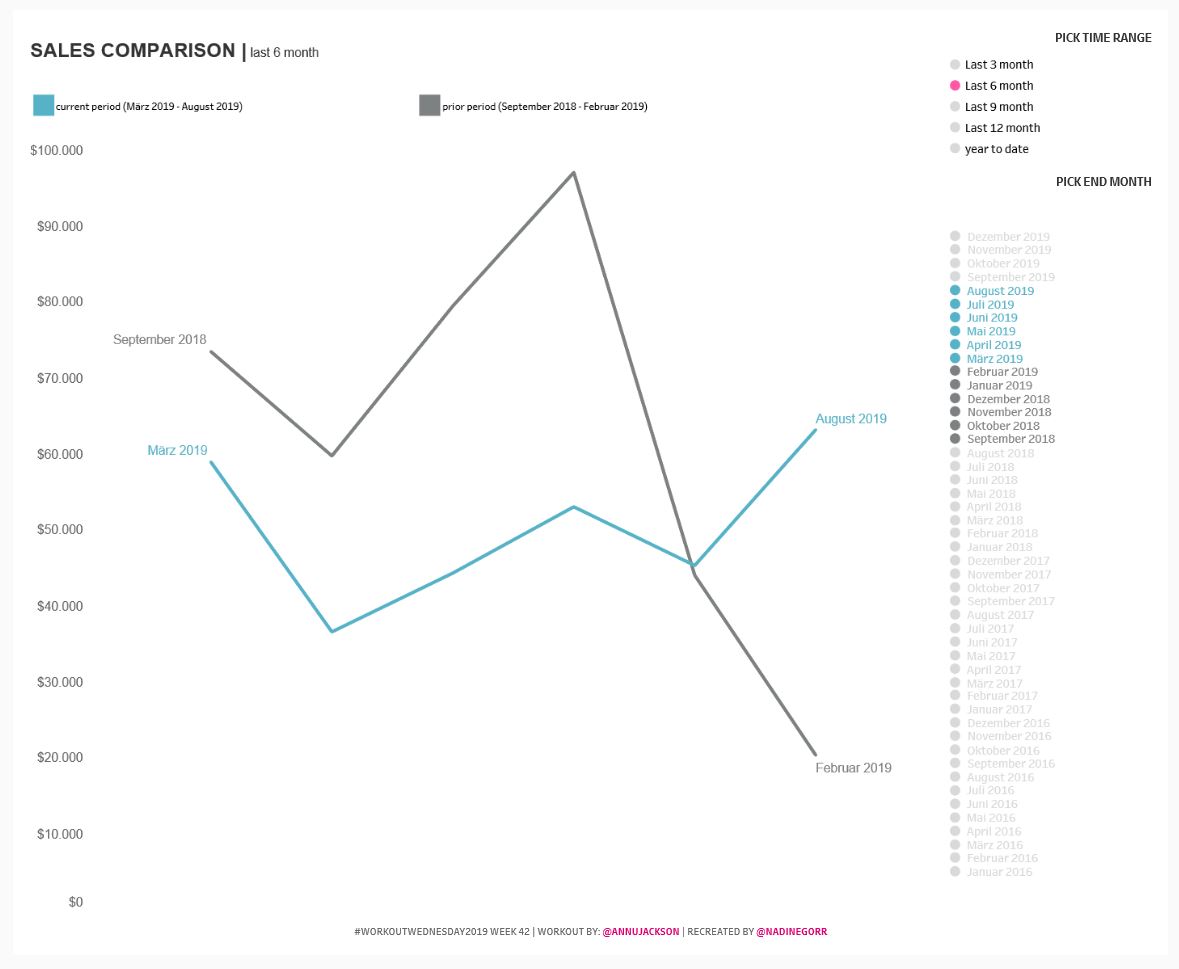
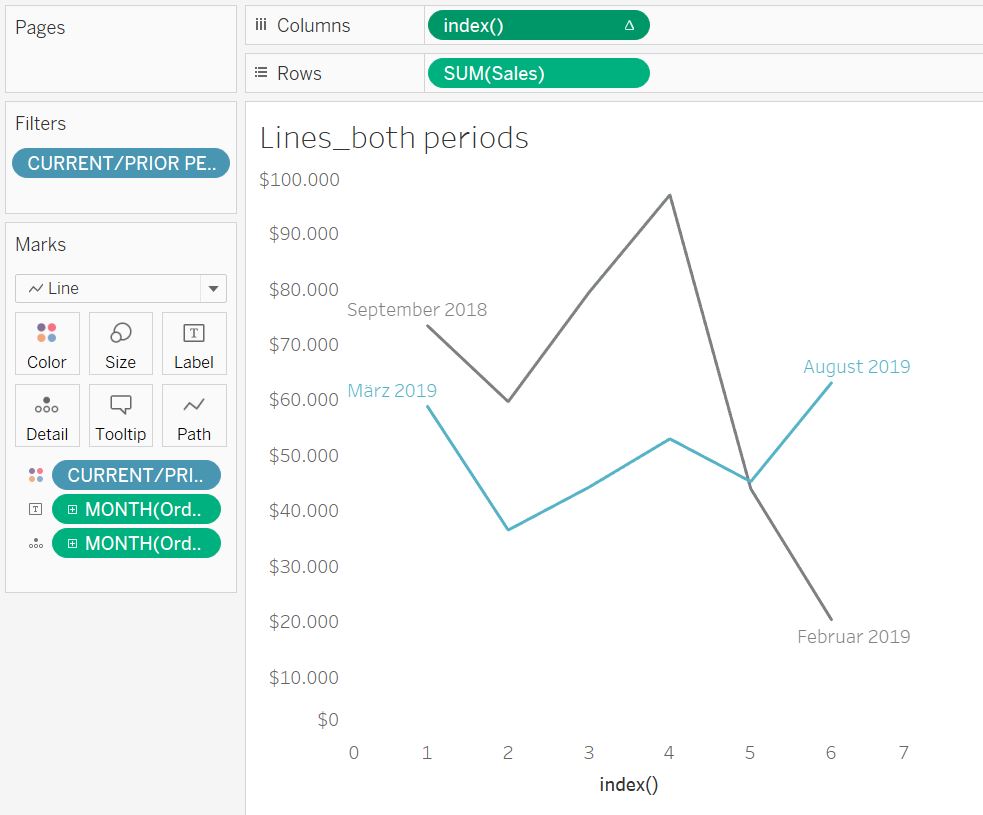
It was #WorkoutWednesday2019 week number 42 and the challenge was to create a line chart with dynamic inputs. If you look at the picture below you will see the final chart I created. There are two lines, showing current and previous period, both periods containing the same number of months. You will also see that the lines, although containing different periods, use the same range on the x-axis. It took me a while to figure out how to do this and the solution was to use the INDEX() function.
Every now and then I stumble over the INDEX() function and I get an idea of its power and broad variety of usage. So this is why I would like to learn more about it and I want to share my learnings with you on this site.
So let´s get started with the function itself. Afterwards I will show you some examples to see what the function can be used for.
INDEX() Table calculation
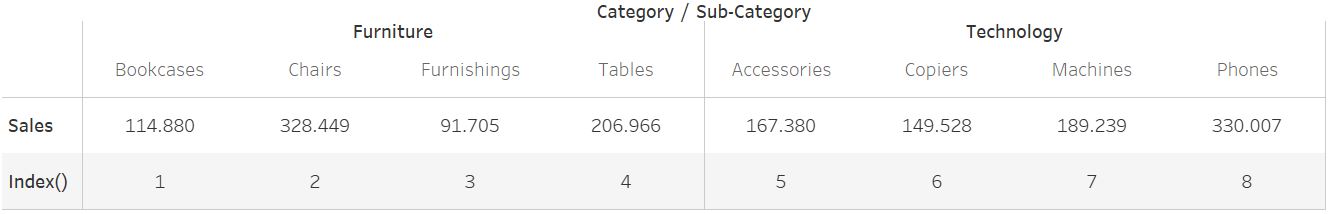
INDEX() is a table calculation, and it “returns the INDEX() of the current row in the partition.” I will show you some examples using Tableau Superstore data.
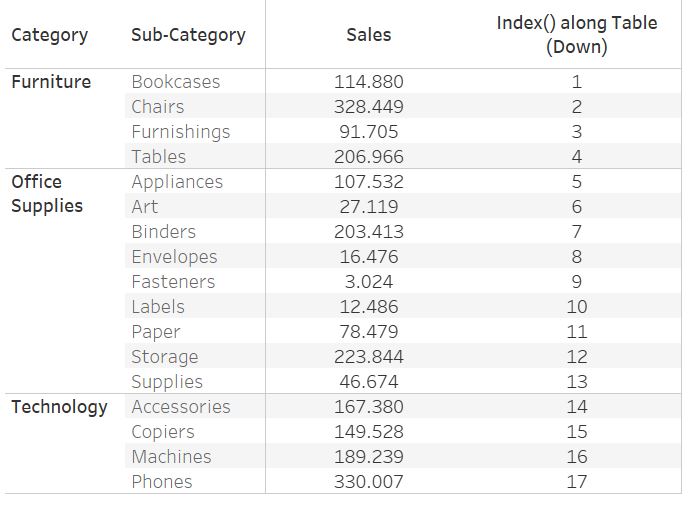
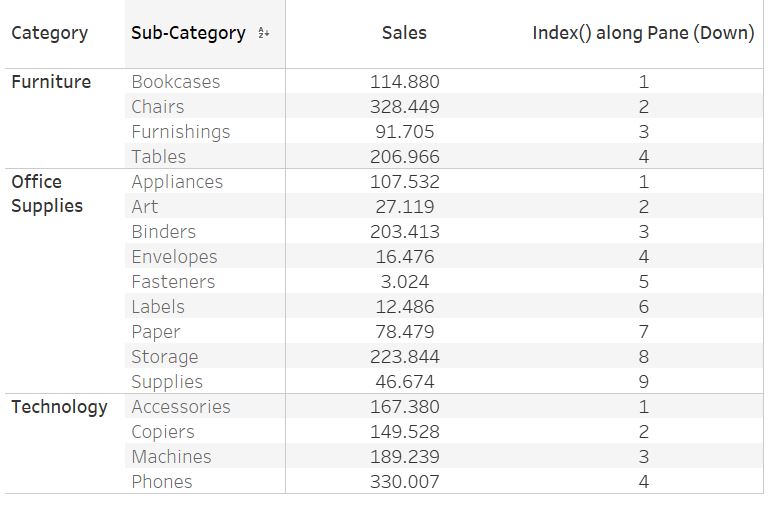
The table above shows what INDEX() does. First row starts with 1 and the number increases for each row by 1. You can now play around with the computation of the table calculation, e.g. INDEX() along Pane (Down) would deliver following results. It restarts counting every pane of the table.
And it works in the same way when arranging your data horizontally:
Example 1 | Use INDEX() to position data on the x-axis
Getting back to my initial example from Workout Wednesday, I will now show you the solution. By having a look at the next picture you will see that INDEX() is used for columns.
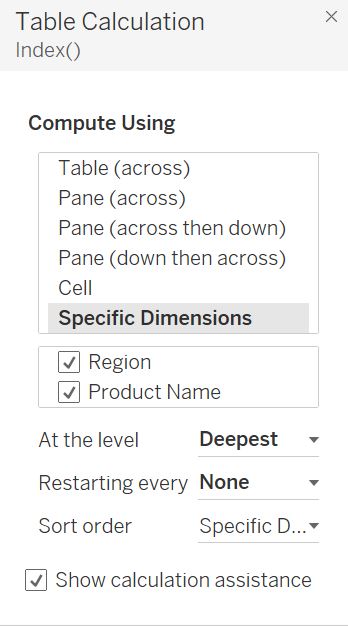
And of course the computation is important to receive the required results. This is how the it should look like:
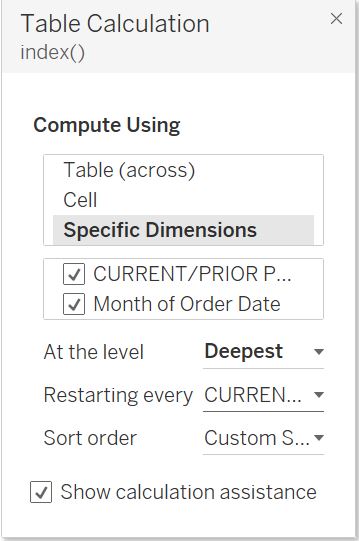
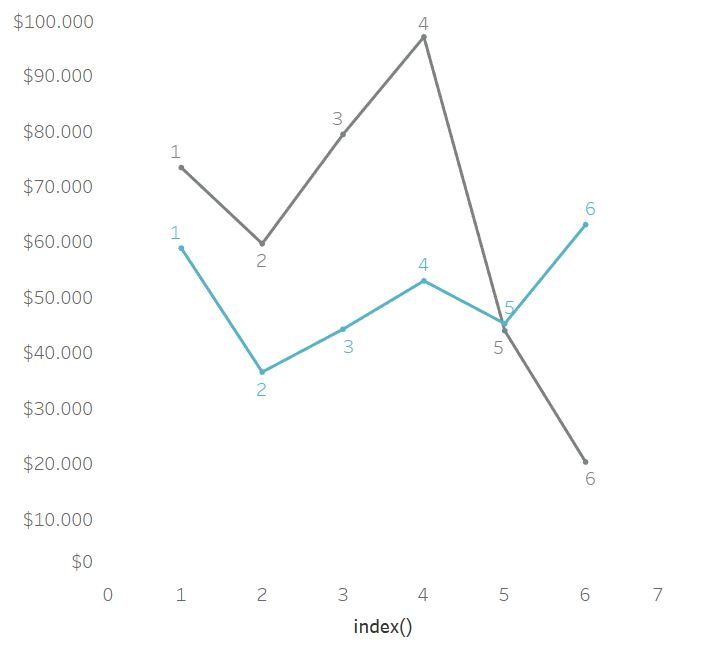
INDEX() will be calculated first along order month and then along both periods (Current and prior). It starts with order month as this dimension is the deepest in the list of dimensions and the deepest level is chosen. It counts from 1 to 6 as it includes 6 months and then switches to the next period, starting from 1 again, because the computation is supposed to restart every period (restart every “CURRENT/PRIOR PERIOD”).
Now I want to show some more examples where INDEX() can be a useful function.
Example 2 | Top N/ Bottom N by using INDEX()
Yes, there is a Top/ Bottom N function within Tableau. But maybe the following situation has happened to you before: You added some filters to your sheet and you also want to add another Top N filter and the results shown in your view do not meet your expectation. They show the Top N values overall not considering the filters used in this view so far.
I will show you a simple example based on Tableau Superstore data. Look at the picture below. It shows a list of products sold in Illinois sorted by profit.
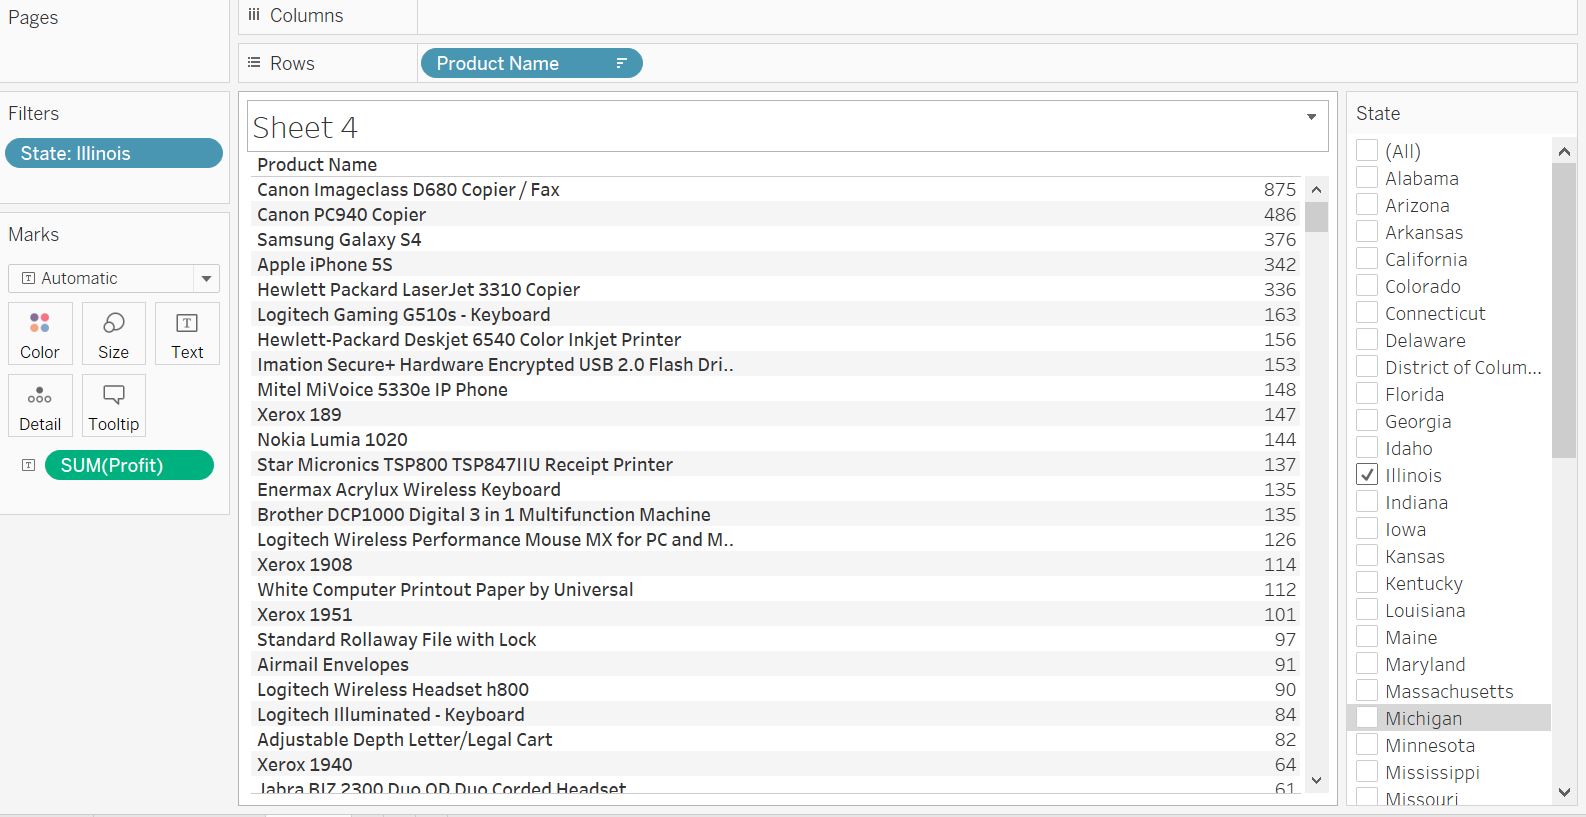
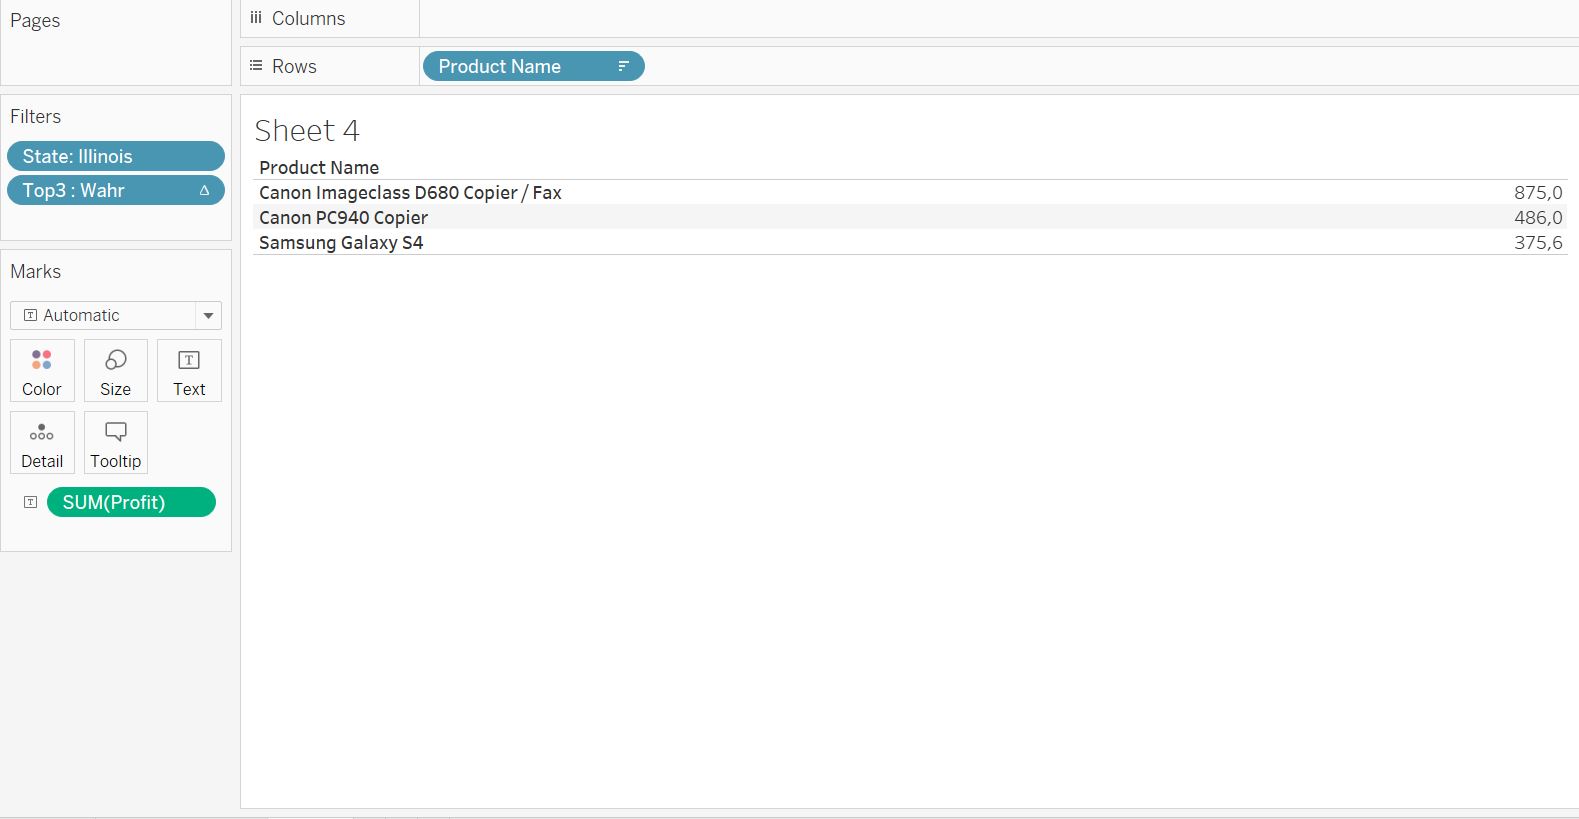
Now you want to see the Top 3 products by profit for Illinois. Obviously it should be Canon Imageclass D680, Canon PC940 and Samsung Galaxy S4.
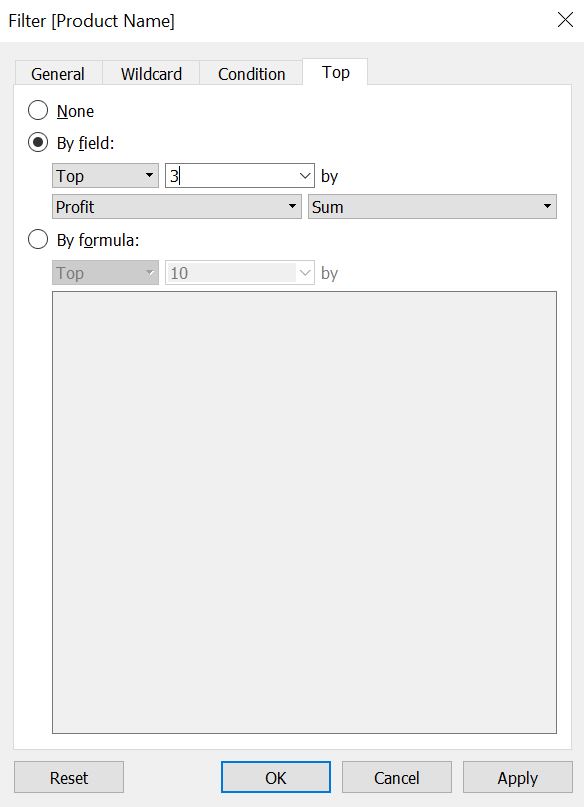
If you simply add a filter for Product Name and choose Top 3 by Sum of Profit (see next picture) you will get a list that a) doesn´t show the products we expected and b) shows less than 3 products for this example.
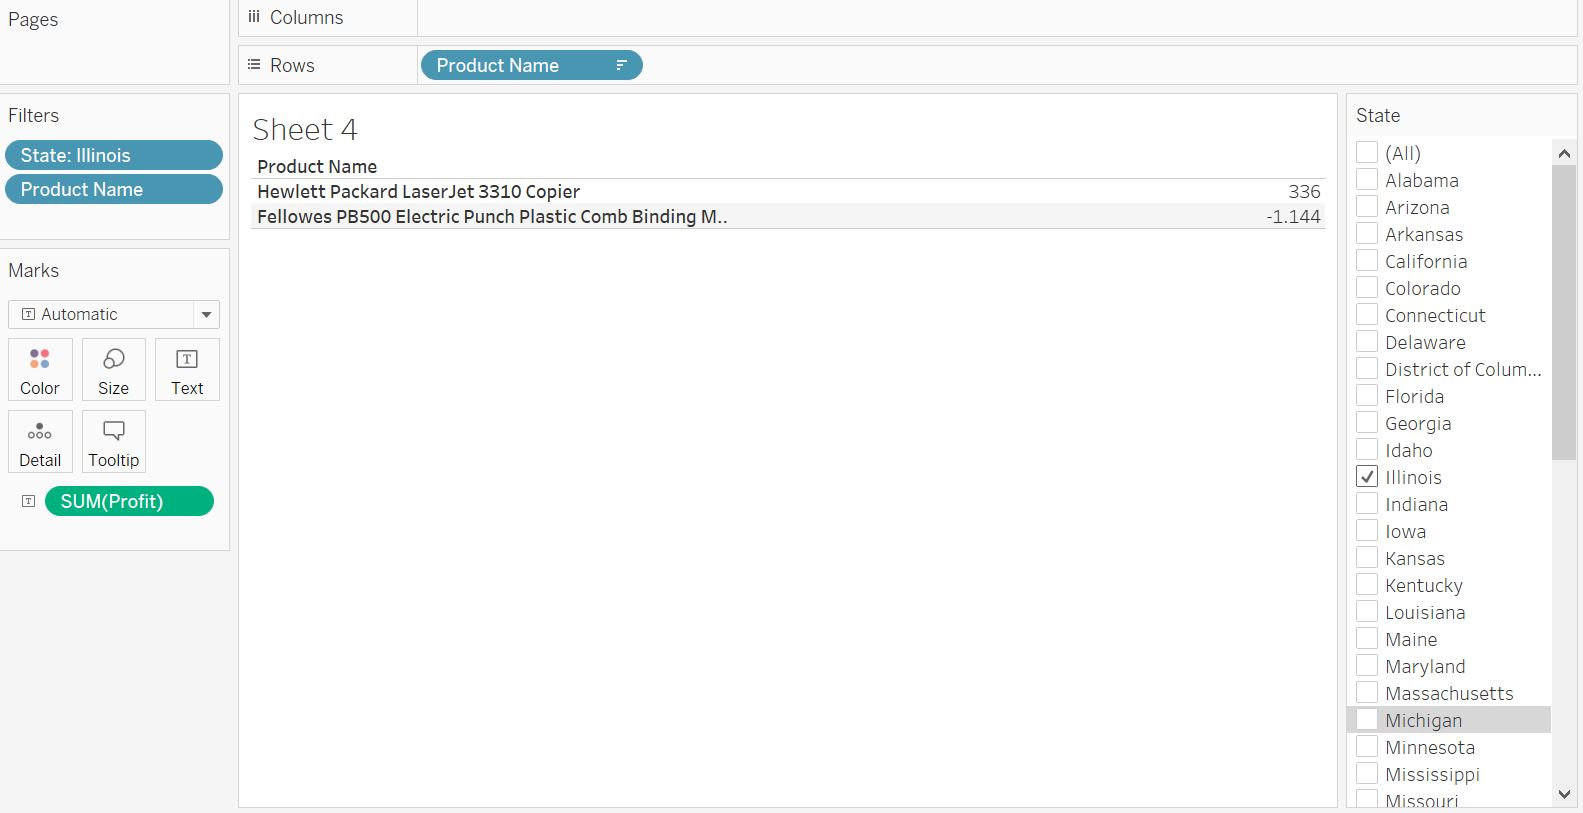
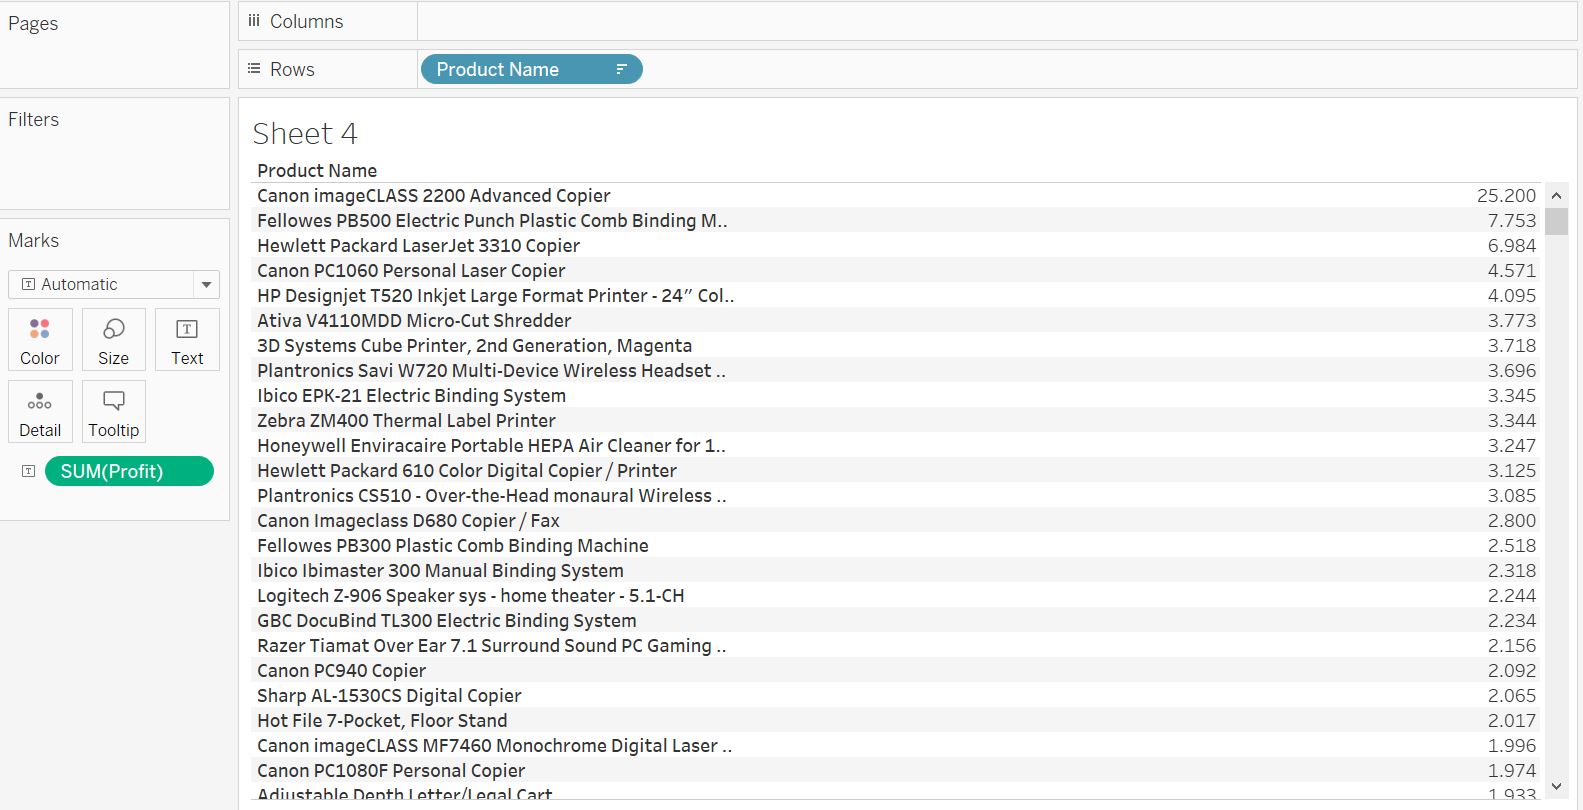
The reason for this is that the TopN filter looks up for its results within the overall list of products and Tableau simultaneously meets all further filter criteria. Let us look at an overall list not filtering for states (picture below). The Top3 would be Canon ImageClass 2200, Fellowes PB500 and Hewlett Packard Laser Jet 3310. Fellowes PB500 and Hewlett Packard Laser Jet 3310 also appeared in the list of TOP3 for Illinois (Image above) which proves that Tableau uses the TopN filter overall not considering other filter. Canon ImageClass 2200 is not be shown in the Top3 list, because there are no results for Illinois, so it gets excluded by the state filter.
How to solve this issue?
Create a calculated field “TopN” (N as your chosen number of ranking positions you want to see. In my case N=3, because I want to see the Top3) and use the expression: index() <= N. This is a boolean expression and its values can be true or false.
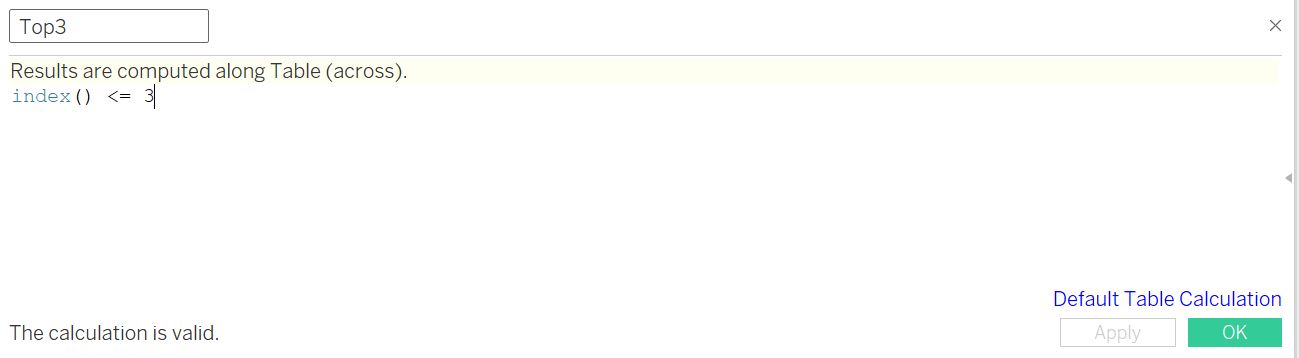
Think about the beginning of this article where I describes what INDEX() does. In this case every row would receive a ranking number, starting by 1. By moving your new calculated field “TopN” ro the filter shelf and select true, you will only receive the values of rows number 1, 2 and 3. If you want to look at BottomN values you just need to change the sorting of your list to ascending and then again filter on index() <= N.
Example 3 | Create a jitter plot by using the INDEX() function
A jitter plot is nice way to clearly visualize a big number of marks and show a deep level of detail.
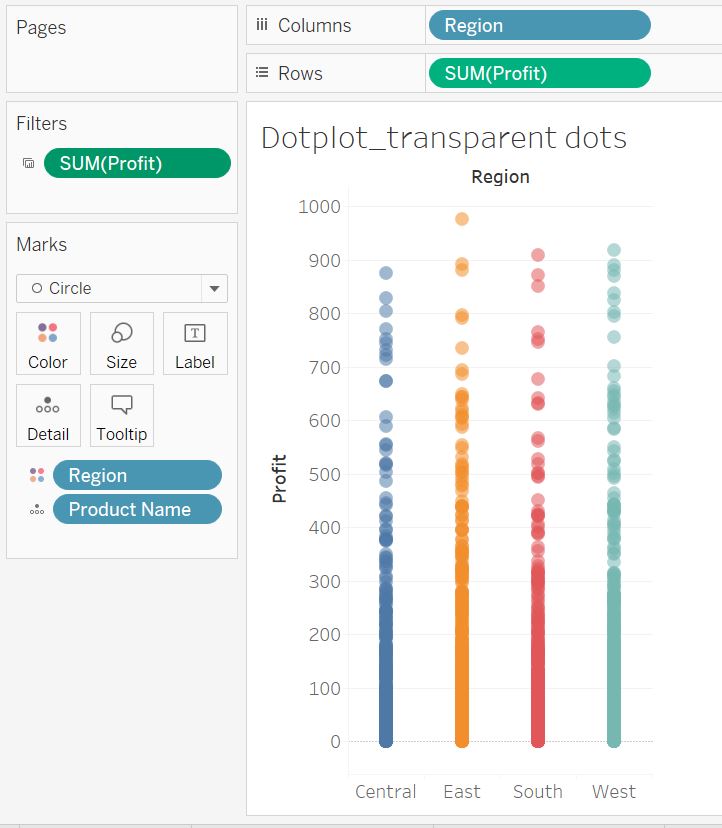
You could use a simple plot, but in case of many single marks they tend to overlap each other and marks could be hidden. A workaround could be to work with transparent color (see next picture) or boxplots to get a better understanding of the data. But in some cases, e.g. for very granular data, it might make more sense to use a jitterplot to avoid the overlap effect.
A jitterplot distributes the marks (kind of) randomly instead of showing the marks in a single line. The example from above would look like this in a jitter plot:
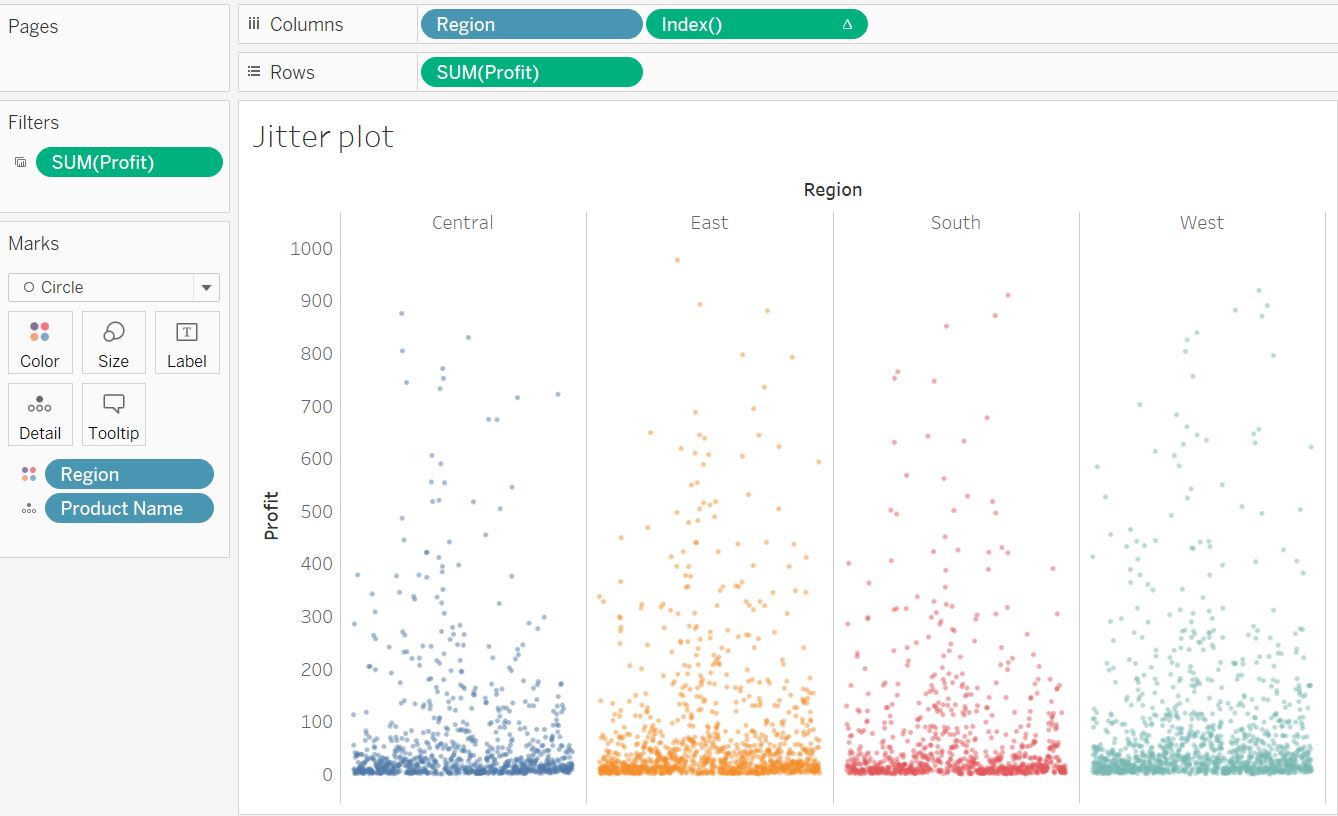
As you can see you will get a much better understanding of the data and its granularity.
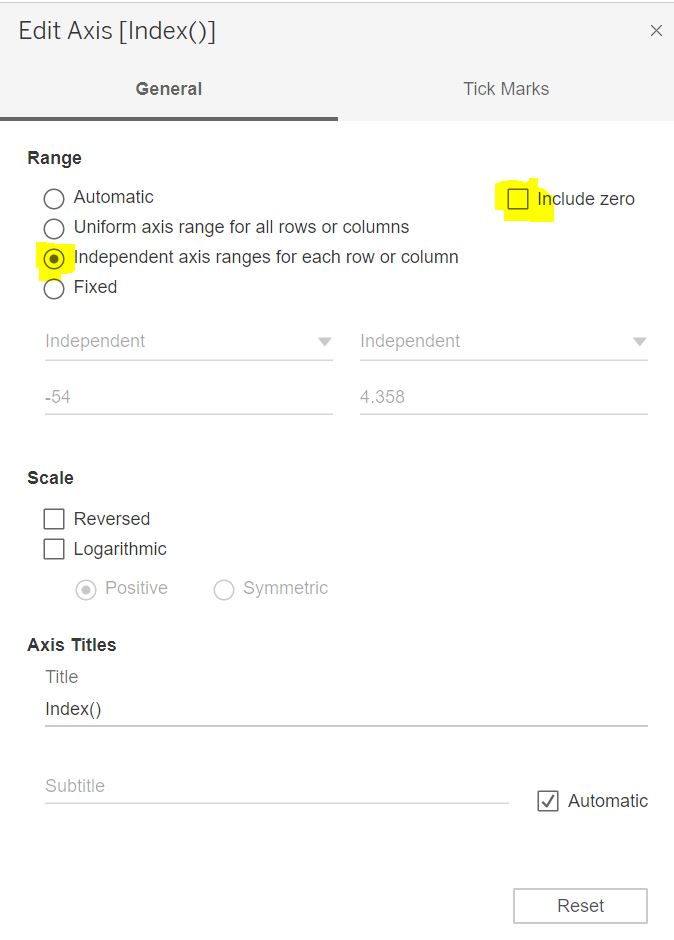
Now how to get there? Again we will use the INDEX() function. If you look at the image of the jitterplot above you will see that I used INDEX() within the columns shelf. In my case the computation of the table calculation looks as follows:
The calculation needs to be computed using all dimensions. Index()-numbers get allocated on the marks and it looks as if marks get distributed randomly on the x-axis. You will also have to edit the x-axis: select independent axis ranges for each column and untick “include zero”.
After going through all those steps you should see your data in a nice jitterplot.
As soon as I stumble upon another issue which can be solved by using INDEX() I will expand this blog post. In case you have some more use cases or issues with INDEX() please let me know and we can have a chat about it.
You can download my TableauPublic workbook with all the examples in this blog post.
Finally I would like to mention a few other blogs I got inspired by for this post:
Data Tomato
Doing Data
WorkoutWednesday
Tableau magic
Playfair Data