
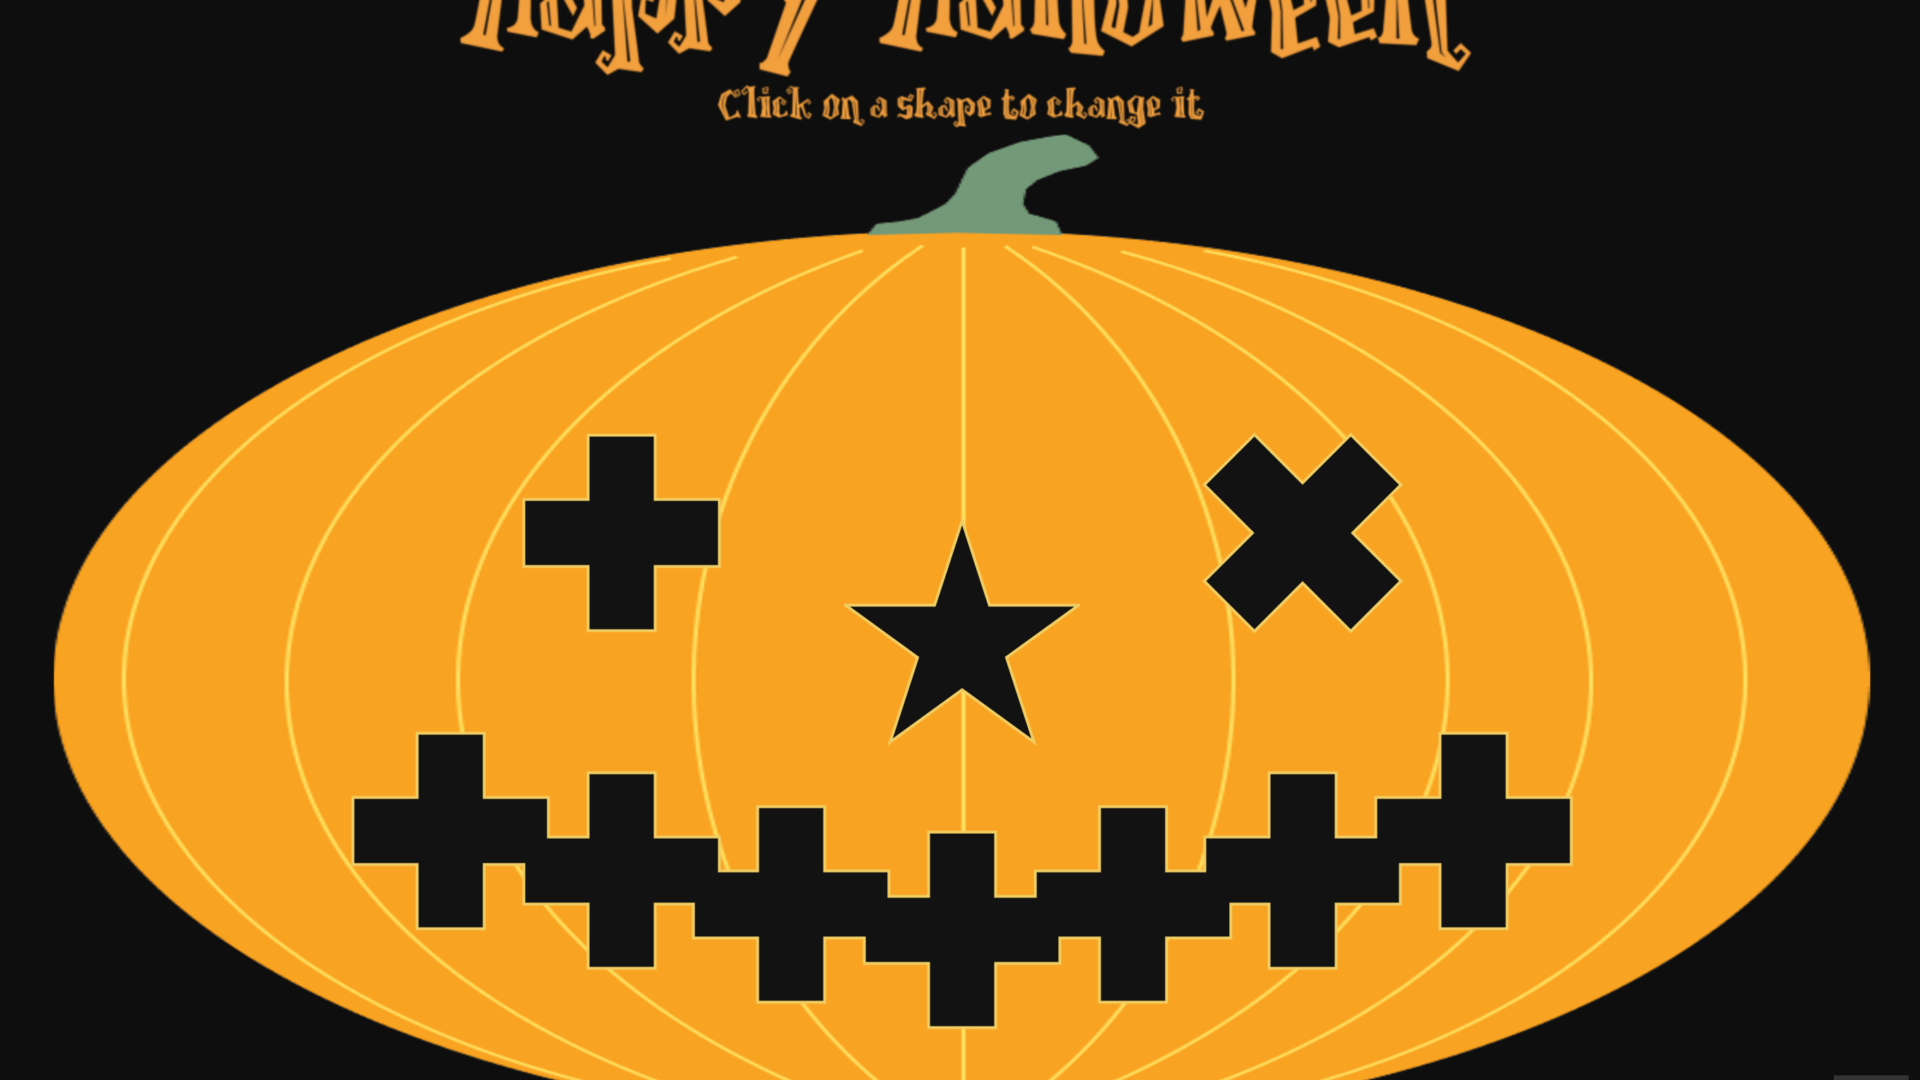

Happy Halloween
As Germany moves back into lockdown-lite it seemed a good time to think once again about parents spending more time at home with their kids. If that is not a frightening enough prospect for Halloween I don’t know what is. As usual at this time of year we carved a few ghoulish pumpkins. Whilst this is fun (once a year), it’s also kind of messy. And since Tableau can do literally everything, what better way to waste an hour or two than by making a Tableau Pumpkin Designer?! Well, ok, maybe there are better things to do, but as usual, once the idea comes along it just has to be done.
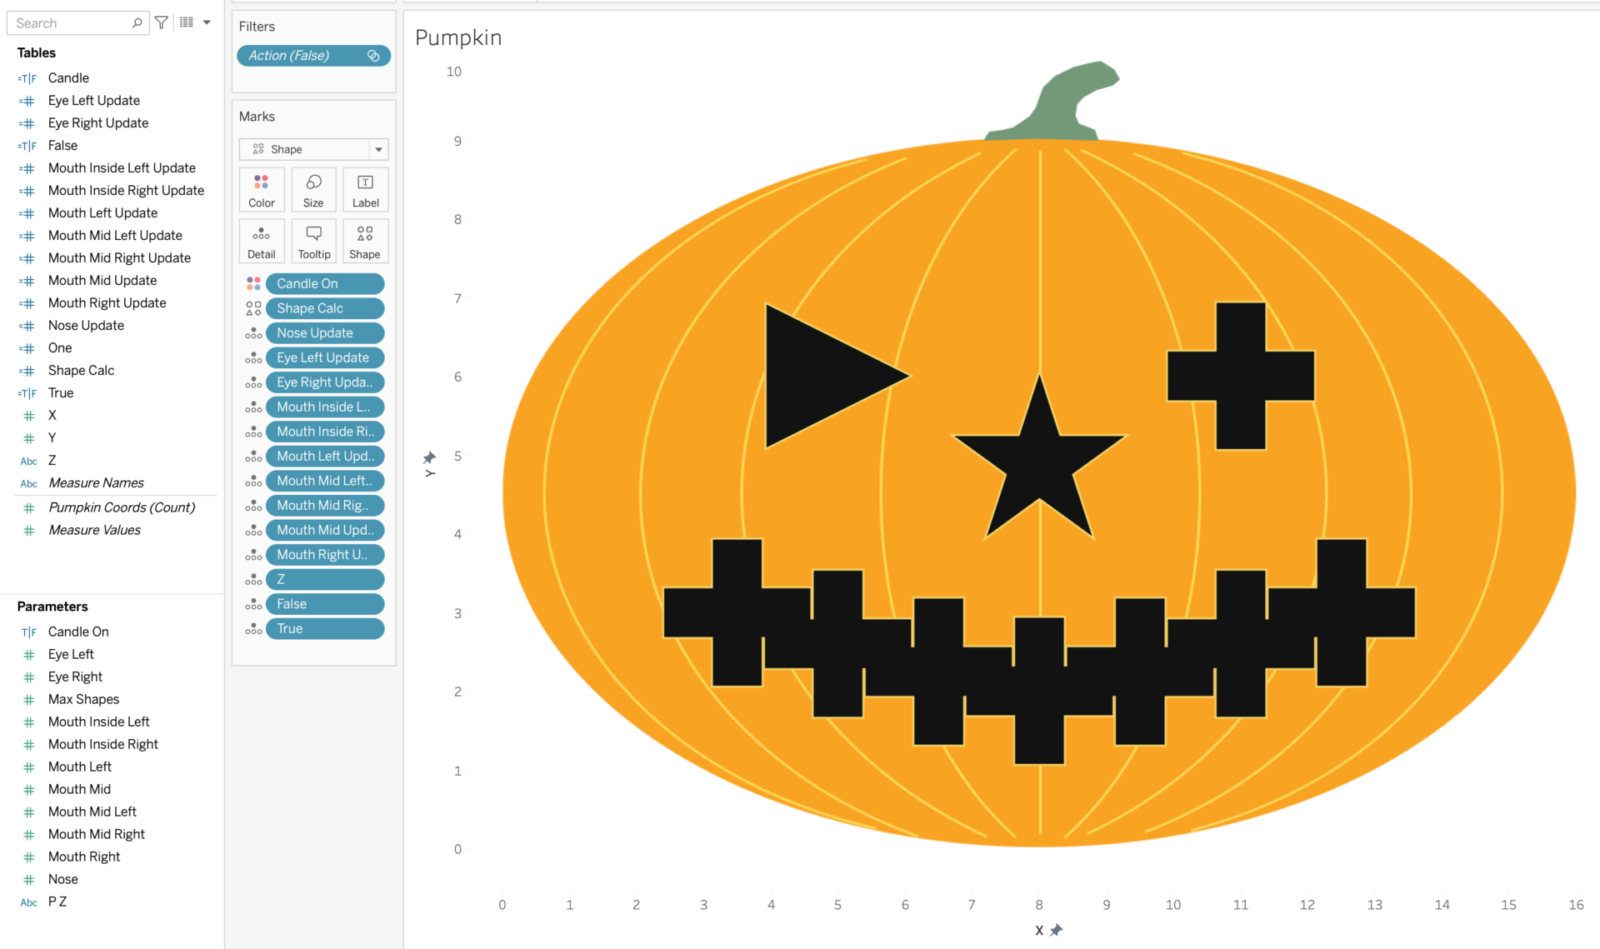
There’s nothing too devilish about any of this, just a simple cartoon pumpkin graphic made in figma and a simple x, y, z dataset that we’ll use to overlay data points on top of the pumpkin. Each data point is given a unique identifier – the z field, containing descriptions like “eye left”, “eye right”, “nose”, etc. – so that we will know which gruesome data point has been selected. Then for each data point we create a corresponding parameter to store a numeric value, and also an update calculation, to increment the hellish values when the corresponding shape is clicked. Something like this in other words:
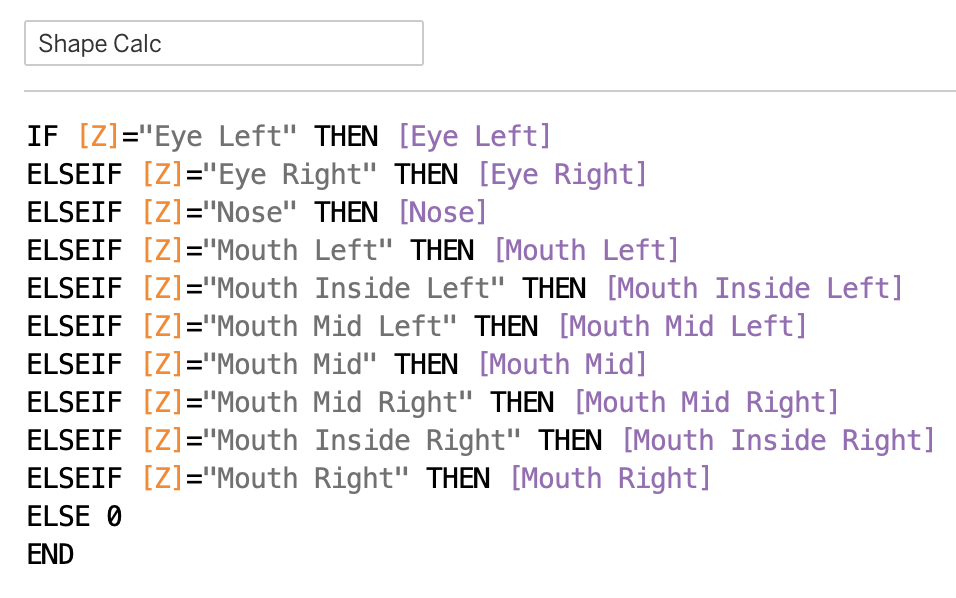
The Shape Calc uses the unique Z values to point to our 10 beastly parameters as follows:
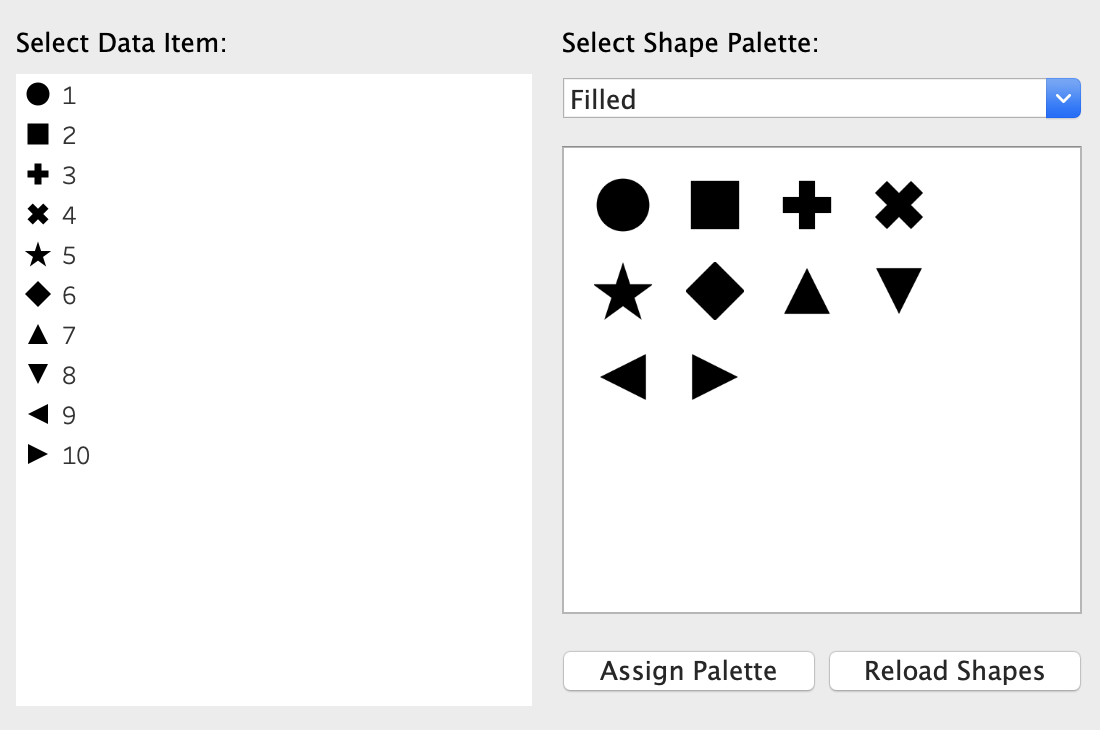
To start with I set each of these 10 parameters to the demonic values 1 to 10, then use the Assign Palette button to map these values to the standard Filled shapes that Tableau ships with. This should ensure that the 10 shapes are always available, even if they are not all in use. Of course you could should design your own much spookier shapes and add them to your Tableau Repository:
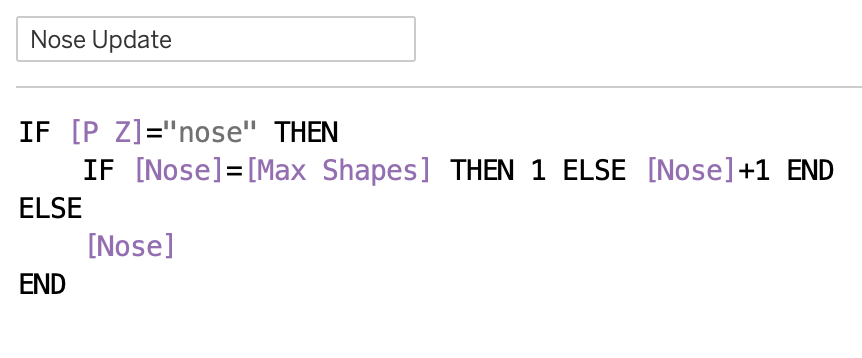
Each of the 10 update calculations follows the same infernal pattern, incrementing by one unless the current value is equal to the maximum value (10 in our case) in which case we reset it to 1:
These 10 update calculations are then used in 10 parameter actions on the dastardly dashboard, to update the 10 parameter values:
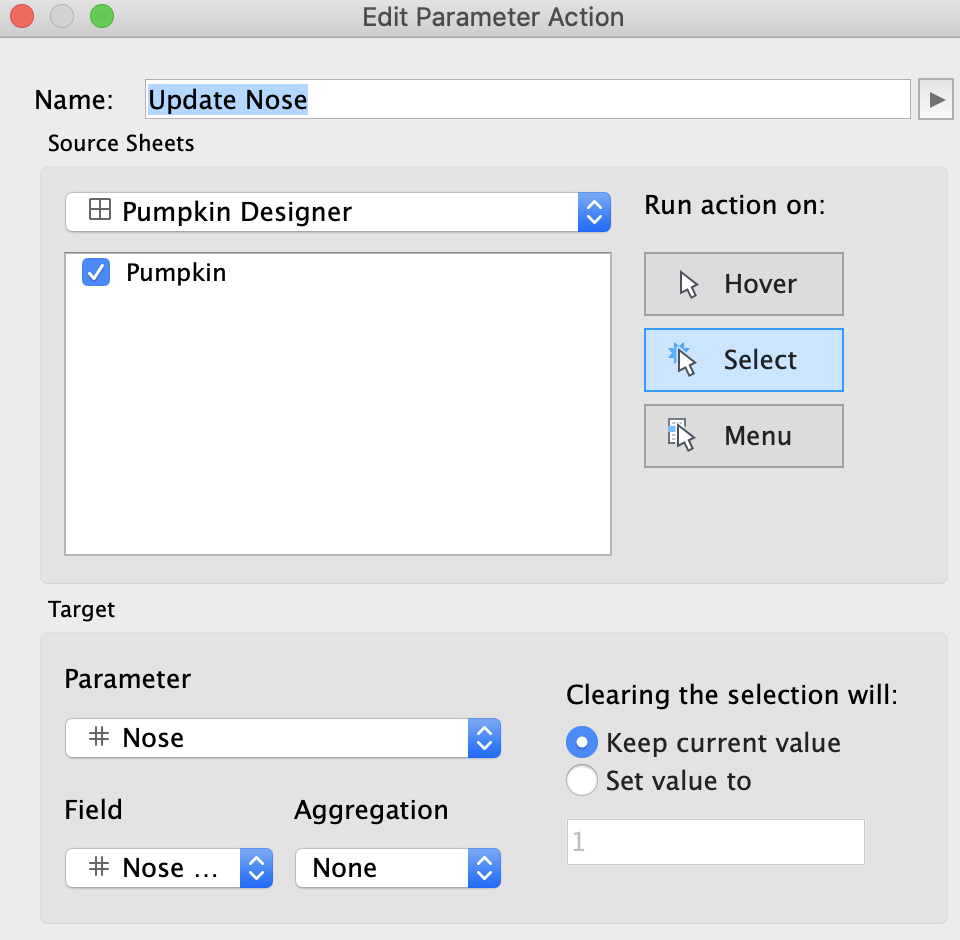
The incomplete Field selection here uses the [Nose Update] calculation for those of you following along.
Next we set up a parameter, P Z, to capture the currently selected shape. This uses the unique identifier in the Z field that was mentioned above:
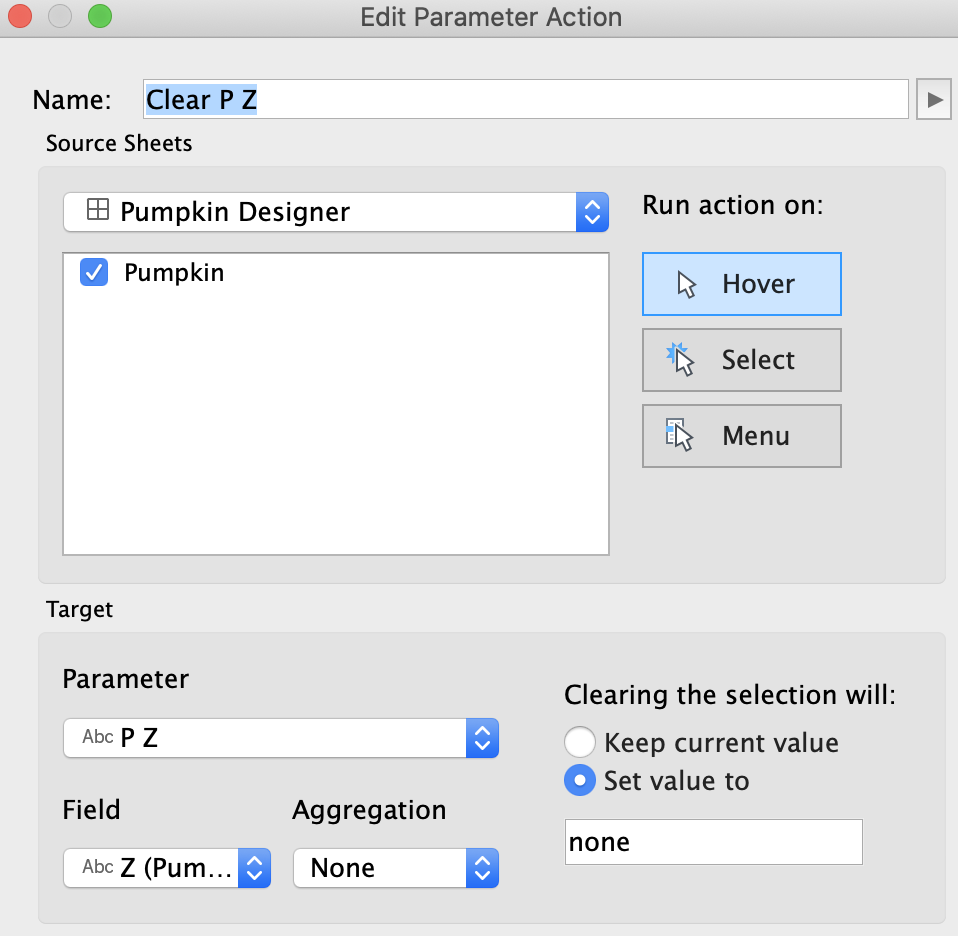
We use a hover action here, so that each mouseover of a shape will update P Z with the Z value. When the selection is cleared we set P Z to “none”, to ensure that we don’t retain any selection that is no longer valid. Curiously, leaving an empty text string here doesn’t seem to work.
That gives us the heart of the viz, but we can always add a few petrifying finishing touches. Firstly there is an extra parameter to control the colour of the shapes – we can use this to simulate lighting a candle in the pumpkin 🙂 And of course a suitably spooky title (available here) and a dark background is a must for Halloween:
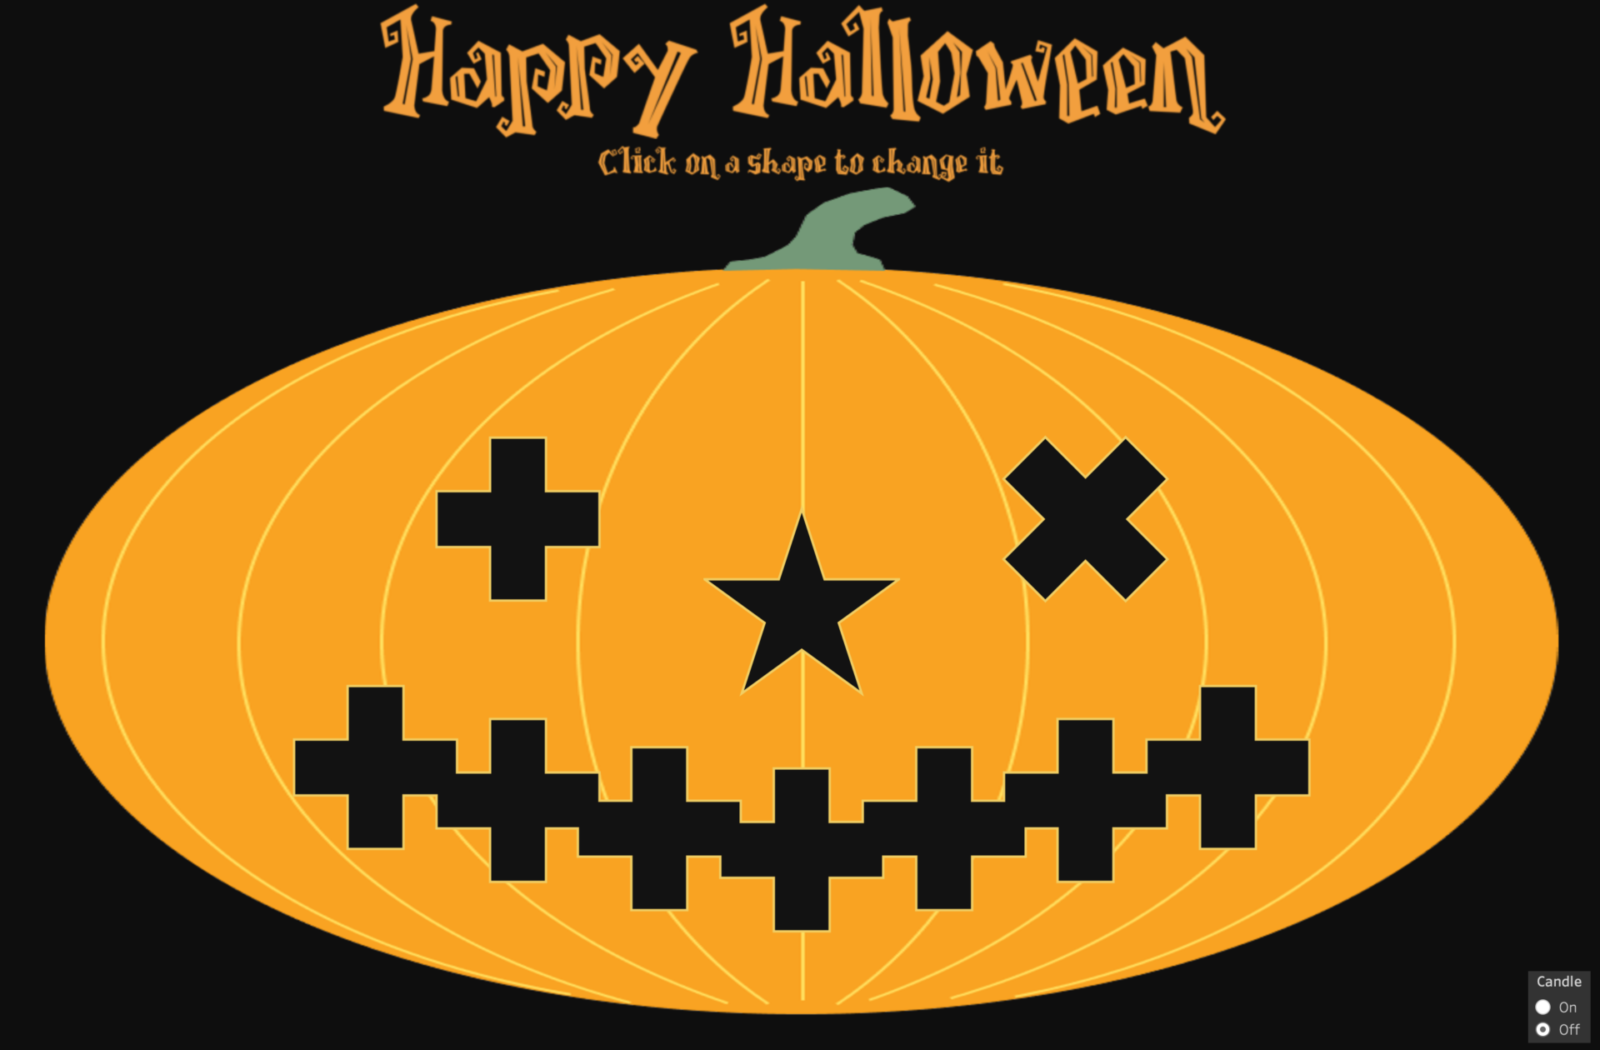
The finished viz is on Tableau Public here. As ever, feel free to download and adapt for your own horrifying uses. Happy Halloween!