

Create a Video Gallery in Tableau
Earlier this year we wrote about how to Create an Image Gallery in Tableau. It feels a bit like another lifetime now, with so many incredible changes to our way of living that have happened in the few short weeks since then. Even though there are way more important things happening, since baking datastrudel still pays the bills it’s time for a sequel.
This time we’re going to show how you can use Tableau to serve up video content. The approach here is actually a lot simpler than with the image gallery. We are simply going to use a Web Page object on our dashboard, linked to video content hosted online, and controlled by a very simple visualization. But what kind of videos we hear you ask?
Well, for the sports fans amongst us, the postponement/cancellation of almost all major sports has left a bit of a gap in our lives. Ok, it’s clearly not the most important consequence of the Covid-19 pandemic, or even in the top 10, but especially in a time of self-isolation, the distraction and drama of sport would be very welcome.
With that in mind, and as a public service, we set about assembling an eclectic mix of sporting highlights from the past few decades. Some are well-known, others less so, and you might just detect the faint whiff of Scottish and German bias in the choices we made. But if you’re desperate for your fix of sport this might just hit the spot.
And so to the technical bit.
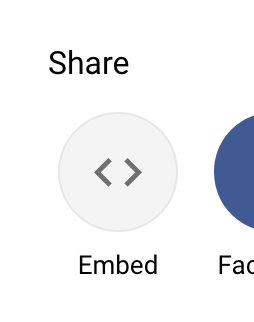
You will need a trusty Excel worksheet (or similar flatfile). Fill it up with a list of your sporting highlights and the corresponding URLs where the videos can be found. Luckily it’s quite easy to link to embedded versions of YouTube videos, so we’ll be sticking to that. Here’s how to get the embedded URLs. First click on the SHARE button below the video:

In the resulting pop-up window click on Embed:
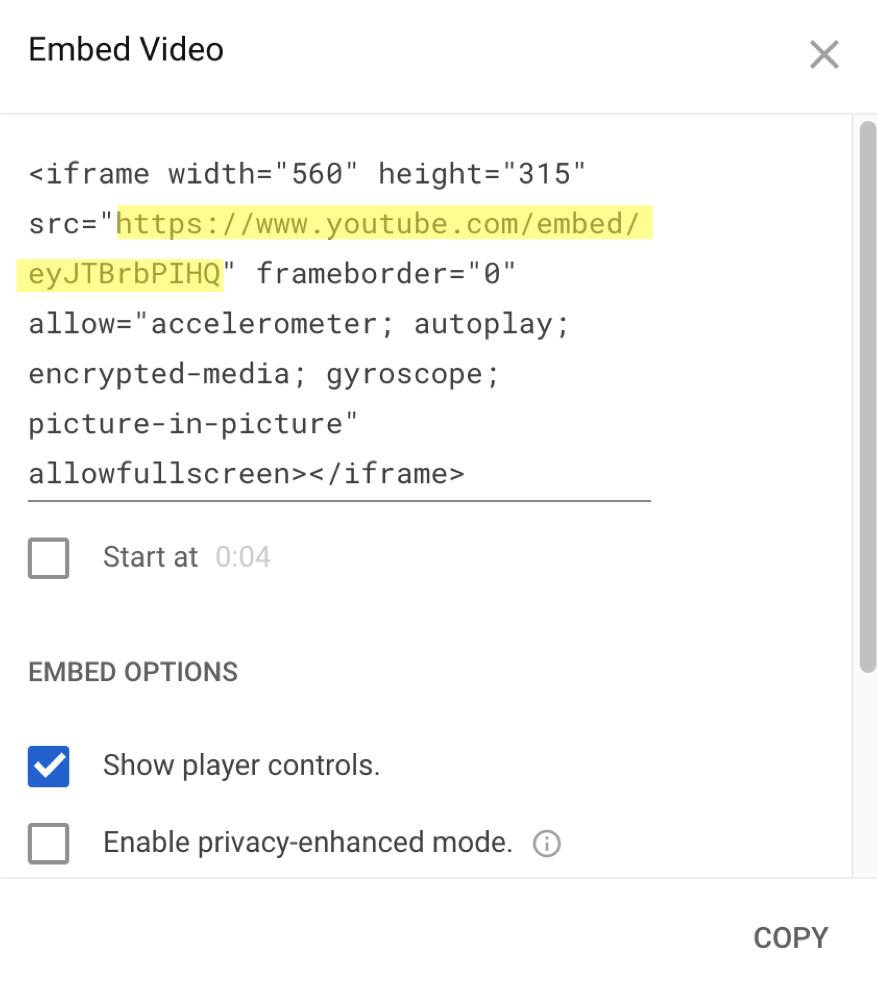
A further pop-up should open. Here you can copy the embed URL (highlighted below) and paste it into your Excel sheet:
Simply do this for each of the videos that you want to display. We probably ought to confess at this point that we haven’t asked for any permission to re-use the videos, so if anyone out there would like anything removed please do get in touch and we’ll be happy to oblige.
Similarly, we can’t guarantee that each video will work in all countries, so just feel warm and happy if they work for you at all. At least at the time of going to press they all work in Germany…
One thing we can definitely say is that not all YouTube videos will work in Tableau. We frequently encountered error messages once we tried embedding them in a dashboard. It seems that the people uploading the videos often prevent them from being viewed outside YouTube. This also explains the non-English commentary in some of the clips 😉
Anyway, hopefully you now have a nicely structured data source that contains your URLs and a few extra bits of information to make sense of them, such as the sport, a description, locations and a date. As usual we gathered a few additional fields that we didn’t use in the end.
Now it’s time to fire up Tableau and load your data source. Inspired by our Image Gallery we decided to select our videos via a simple timeline. Create a worksheet and add in a symbol for each URL as follows:
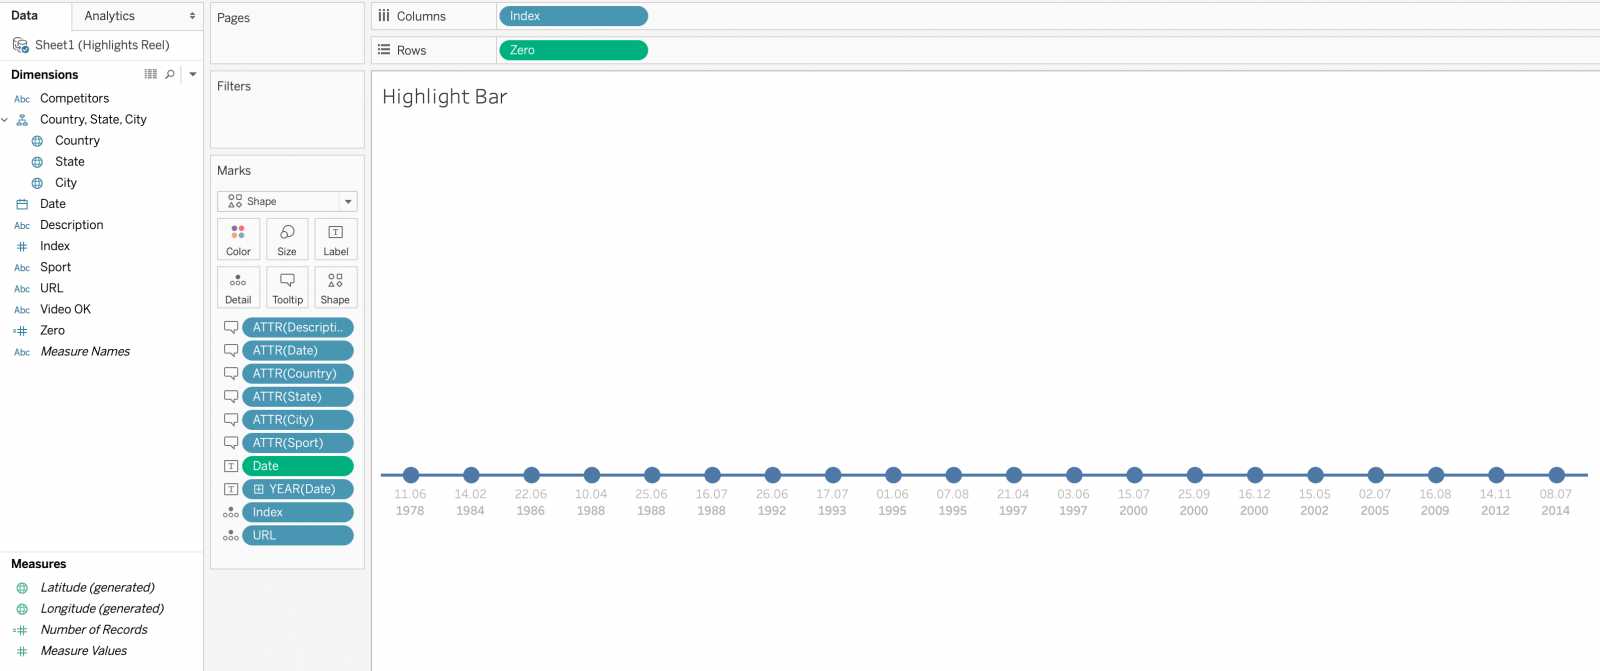
Some minimal formatting helps make things look nice and clean. In particular we chose to split the date labels into dd.mm and yyyy on a separate line. This helps prevent the dates from overlapping, as well as being a bit easier on the eye in our opinion. Don’t forget to format your tooltips nicely as well, since these will inform the users about the contents of each video.
Next create a dashboard – all of our videos are meant to be viewed in landscape format, so we fixed our dashboard size accordingly. Drop a vertical container in and place your worksheet inside it. Next drag a Web Page above the worksheet. Since the YouTube videos don’t all fill the entire screen, and most tend to have black borders, we set our dashboard to be black and our worksheet to be transparent.
The final piece of the puzzle is to use a URL Action, so that any selection on the worksheet will update the URL used in the Web Page:
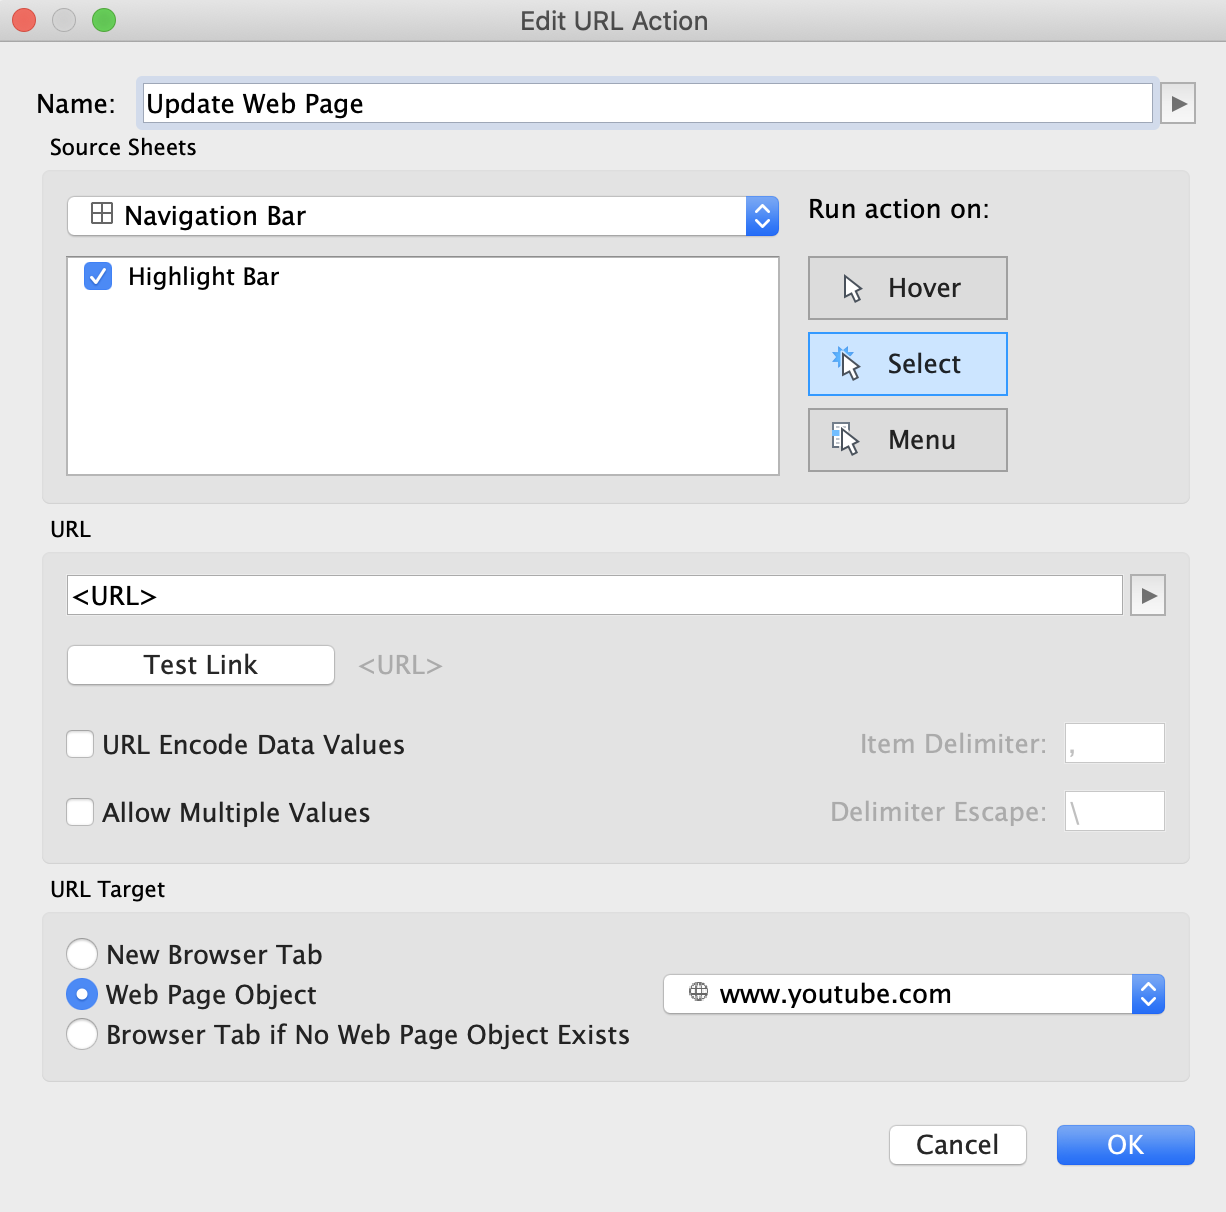
The <URL> in the middle is the field in our data containing the URL.
That’s it! We sometimes had some trial and error, trying out various videos for particular sporting events until we found one that worked embedded in Tableau, but otherwise it was plain sailing.
Obviously this is quite a quick and dirty solution. It would be preferable to have more control over the videos themselves, or to have them hosted in a more controlled environment. One example in a business setting could be a series of Tableau (or other) training videos, all linked together in a dashboard.
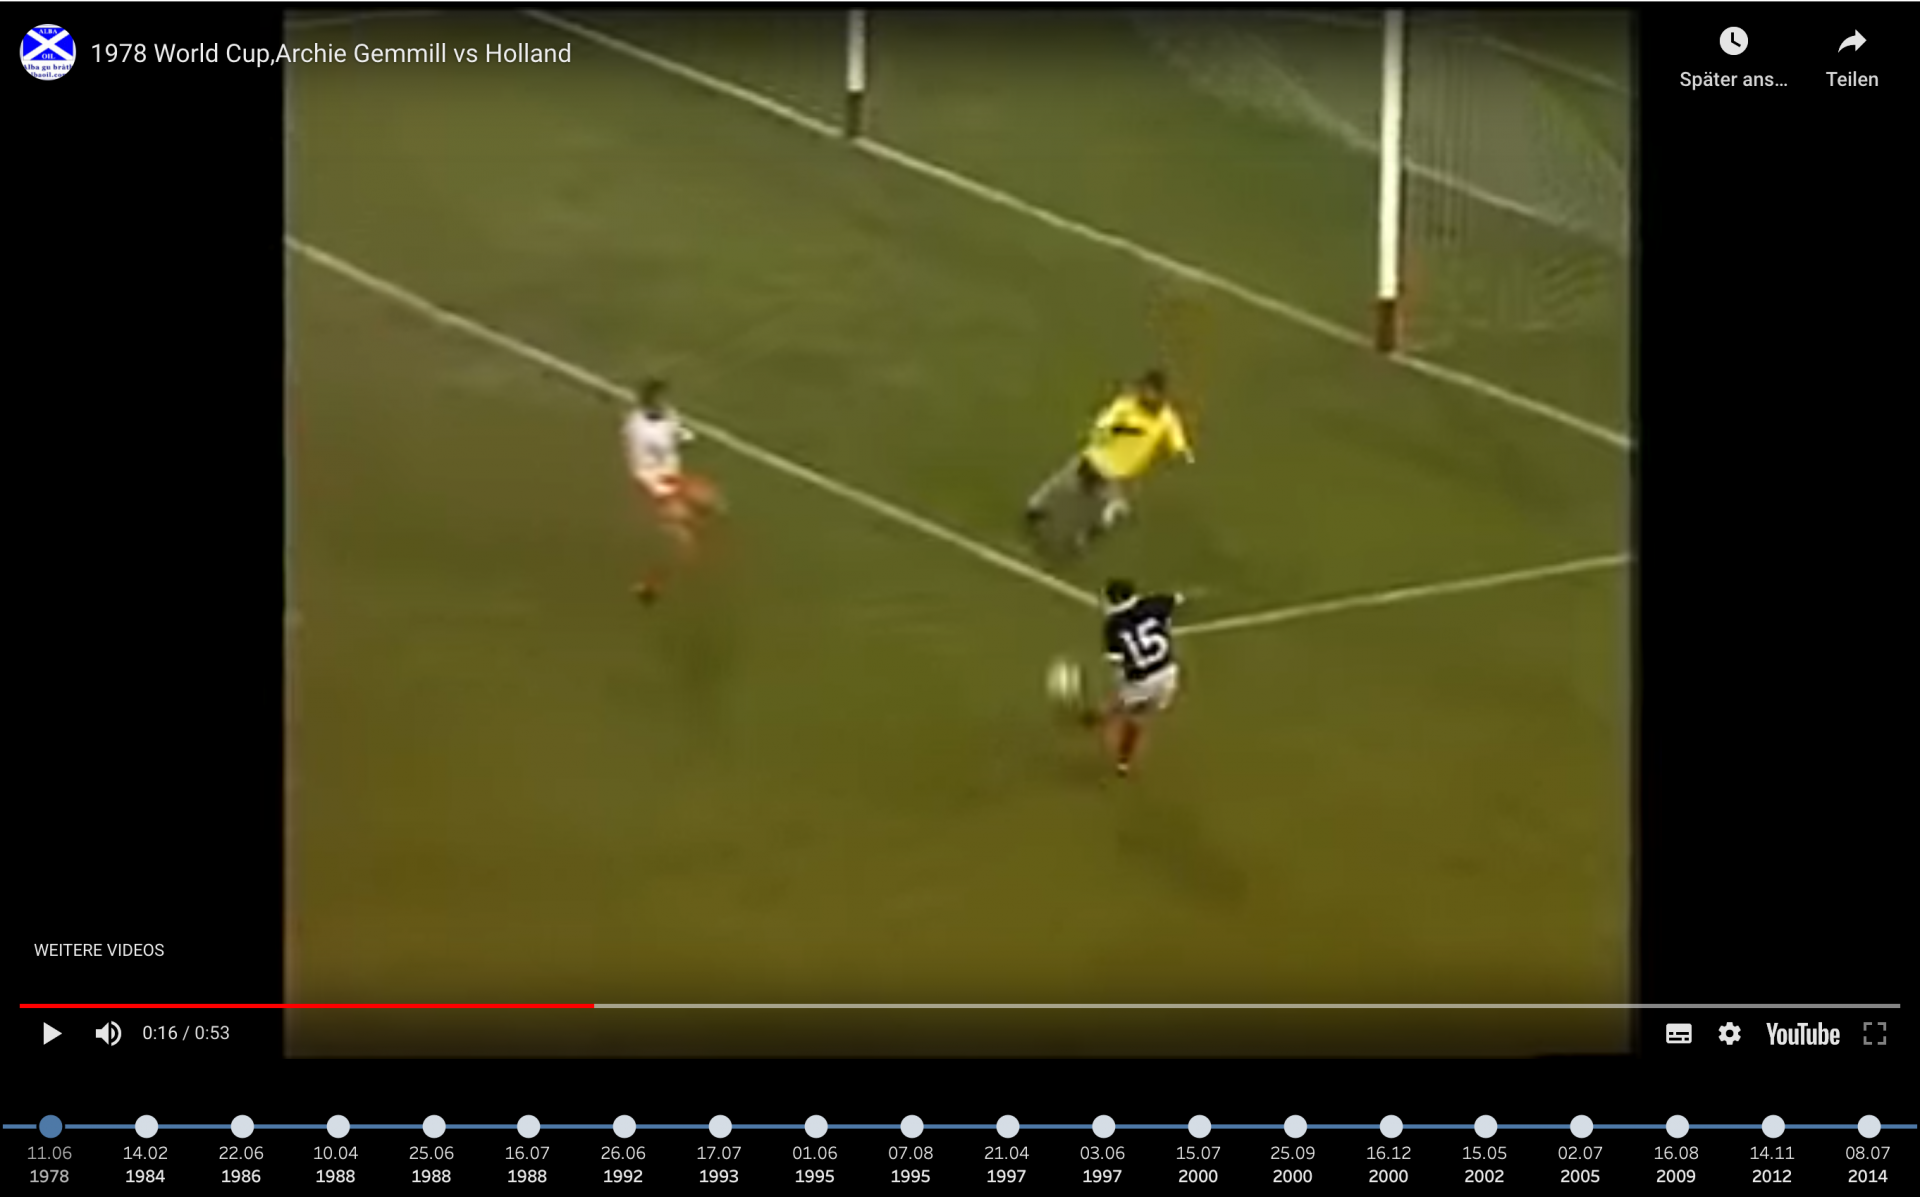
Our final gallery looks like this, with the incomparable Archie Gemmill here in full flow:
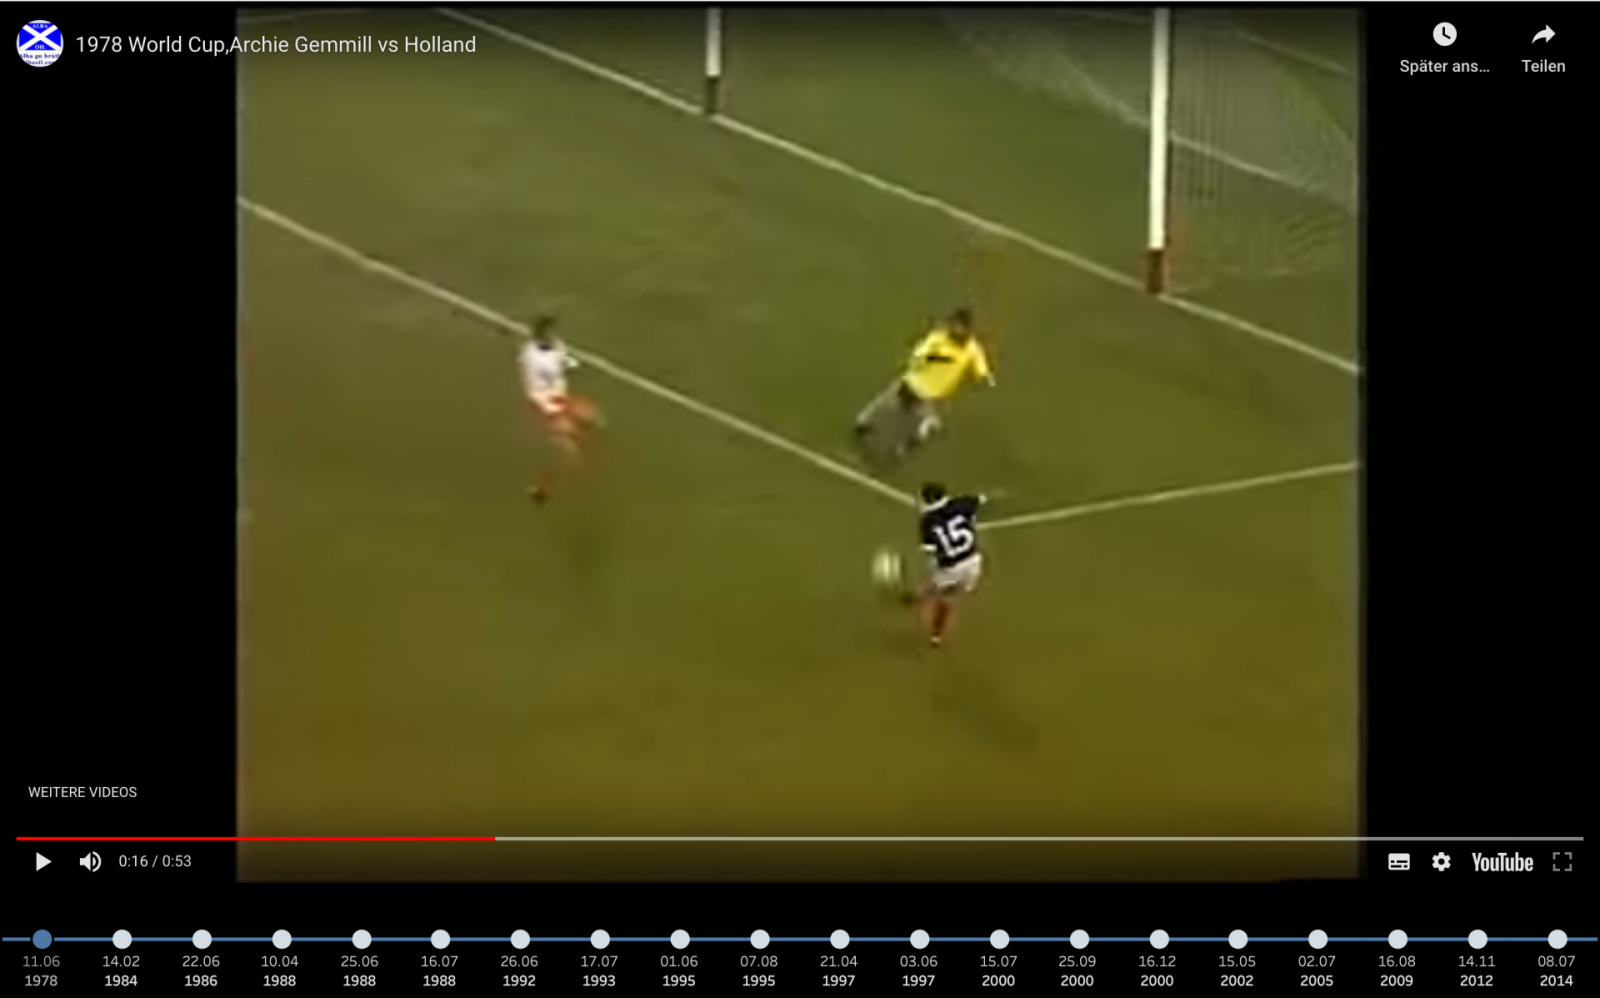
The full version can be seen over on Tableau Public. Enjoy and let us know what you think!